problem with the file resulted from reclasification using CDO
Added by Amelia Fitri 12 months ago
Hello,
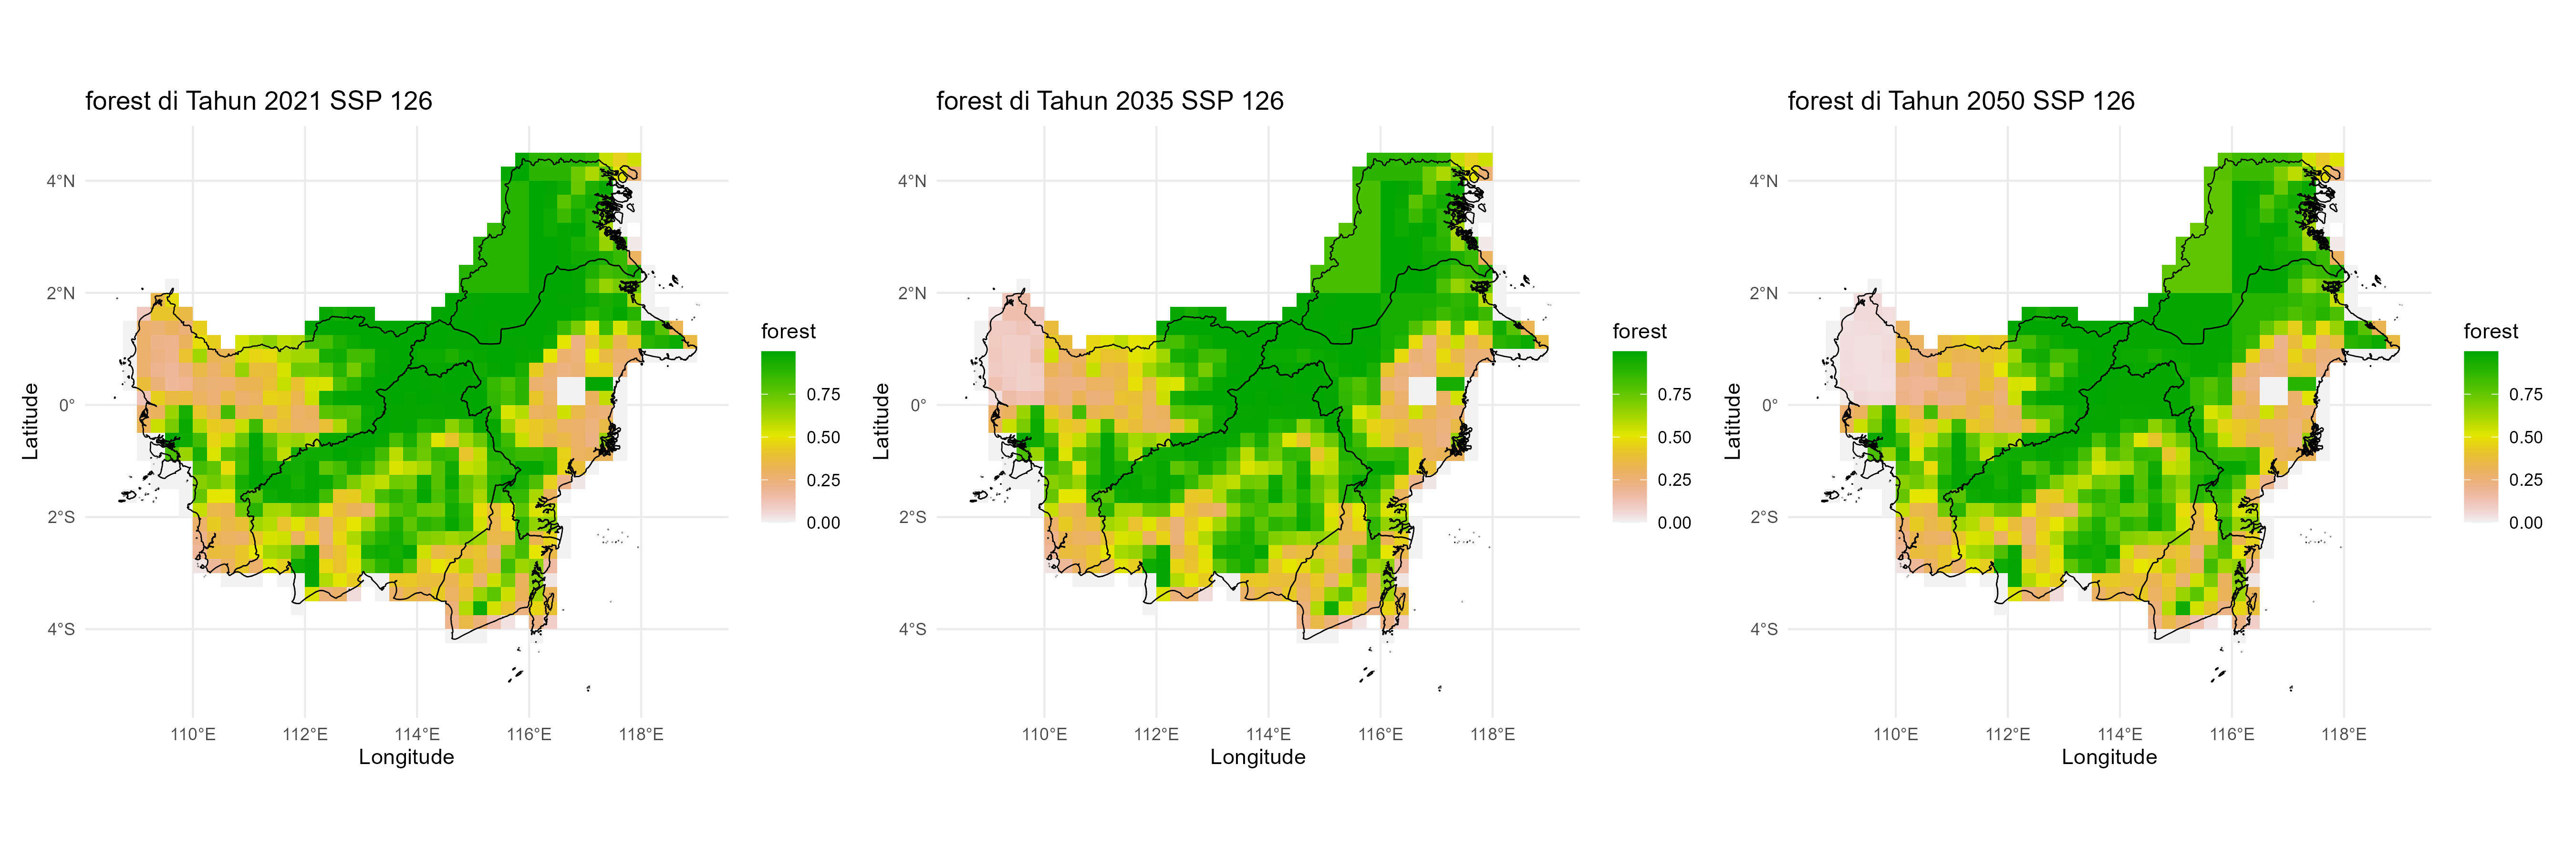
I am trying to reclassify the variables in the Land Use Harmonized Dataset, version 2 (LUH2), which is used in the CMIP6 models. There are 12 land use variables in it, and I want to reclassify them into 4 groups: forest, open area, urban, and cropland.
I am using the script below:
cdo seldate,2021-01-01,2050-01-01 luh_370.nc waktu_370.nc
cdo sellonlatbox,108,120,-5,7 waktu_370.nc kalimantan_370.nc
cdo expr,"forest=primf+secdf" kalimantan_370.nc forest370.nc
cdo expr,"openarea=pastr+primn+range+secdn" kalimantan_370.nc openarea370.nc
cdo expr,"cropland=c3ann+c3nfx+c3per+c4ann+c4per" kalimantan_370.nc cropland370.nc
cdo selvar,urban kalimantan_370.nc urban370.nc
cdo merge forest370.nc openarea370.nc cropland370.nc urban370.nc uncrop370.nc
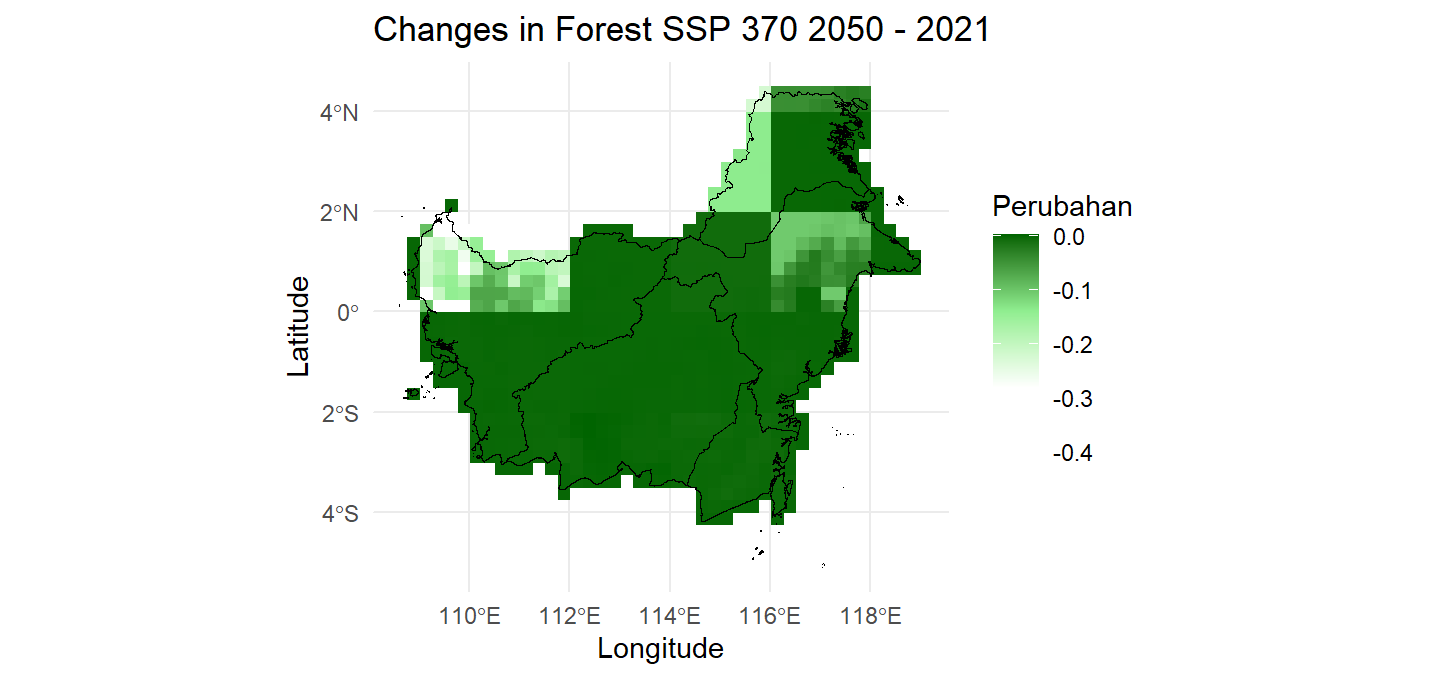
However, from the visualization of the uncrop370.nc file, the results seem incorrect. I tried plotting the changes in the forest variable for the years 2050 and 2021 using R Studio with the script below, but the results are also incorrect. Can someone help me?
library(terra)
library(ggplot2)
library(sf)

# Function to process and plot difference for any dataset
plot_difference <- function(dataset_name) {
  # Baca shapefile Kalimantan
  kalimantan <- vect("D:/DataThesis/SHP KALIMANTAN/Shp_Kalimantan.shp")

  nc_path <- "D:/proyeksi/uncrop370.nc"

  rast_data <- rast(nc_path, subds = dataset_name)

  nlyr(rast_data)

  data_2021 <- rast_data[[1]]
  data_2050 <- rast_data[[30]]

  data_2021_crop <- mask(crop(data_2021, kalimantan), kalimantan)
  data_2050_crop <- mask(crop(data_2050, kalimantan), kalimantan)

  data_diff <- data_2050_crop - data_2021_crop

  df_diff <- as.data.frame(data_diff, xy = TRUE)
  names(df_diff)[3] <- "difference"

  ggplot(df_diff) +
    geom_raster(aes(x = x, y = y, fill = difference)) +
    scale_fill_gradientn(
      colours = c("white", "white", "lightgreen", "darkgreen"),
      name = "Perubahan"
    ) +
    geom_sf(data = st_as_sf(kalimantan), fill = NA, color = "black", size = 0.5) +
    theme_minimal() +
    labs(
      title = paste("Changes in ", tools::toTitleCase(dataset_name), "SSP 370 Tahun 2050 - 2021"),
      x = "Longitude", y = "Latitude"
    )
}

# Call the function for each dataset
plot_difference("forest")
Replies (2)
RE: problem with the file resulted from reclasification using CDO - Added by Amelia Fitri 12 months ago
here, I attached the file
| kalimantan_370.nc (3.86 MB) kalimantan_370.nc |
RE: problem with the file resulted from reclasification using CDO - Added by Karin Meier-Fleischer 12 months ago
Unfortunately, we cannot do much with the brief statement that the results with CDO and R appear to be incorrect.
Perform the same calculations in R and then compare them with the CDO results. Sorry, we are not R experts.