mix ERA5 and ERA5T data netCDF new dimension expver
Added by Carl Svoboda about 6 years ago
I have downloaded yearly data sets in netCDF format from ERA5. My 2019 is a mix of ERA5 and ERA5T data, whereas the data for 2018 is just ERA5 data.
'For netCDF requests which return a mixture of ERA5 and ERA5T data a new dimension is created called expver containing 1 and 5. A single time coordinate is used which covers the entire requested period'.
So data for 2019 is a mix of ERA5 (level 01) AND ERA5T (level 05). Months Jan-Nov being level 01 (with Dec as empty values) and Dec being level 05 (with Jan-Nov as empty values).
My ultimate aim is to make one continuous history from Jan 2018 to present so to combine 2019 with all previous years: (which don't have this extra expver dimension).
cdo copy DE_t2m_2018.nc, DE_t2m_2019.nc outfile.nc
Any advice if I can combine level 01 and 05 into one single level and get rid of the expver dimension?
Perhaps it would just be easier to download Jan-Nov 2019 in one file and Dec 2019-present in another.
Thank you
| DE_t2m_2019_01.nc (2.78 MB) DE_t2m_2019_01.nc | |||
| DE_t2m_2018_01.nc (1.44 MB) DE_t2m_2018_01.nc |
Replies (13)
RE: mix ERA5 and ERA5T data netCDF new dimension expver - Added by François Roberge over 4 years ago
Hello,
Did you ever found a cdo solution to this?
The xarray solution "ds_new = ds.reduce(np.nansum, dim='expver',keep_attrs=True)" works nice, but I wonder if there is an easy cdo way to do this....
Thank you,
François
RE: mix ERA5 and ERA5T data netCDF new dimension expver - Added by Ralf Mueller over 4 years ago
hi!
CDO dows recognize the expver dimension as a vertical level, so a split along this dimension together with the option `-reduce_dim` should work:
cdo --reduce_dim splitlevel DE_t2m_2019_01.nc DE_t2m_2019_split
you can though just use the vertsum operators and keep you fingers crossed because of the nan-handling:
cdo -vertsum DE_t2m_2019_01.nc out.ncThe output is very similar to your xarray solution (max diff 10^-5)
hth
ralf
RE: mix ERA5 and ERA5T data netCDF new dimension expver - Added by François Roberge about 3 years ago
Ralf Mueller wrote in RE: mix ERA5 and ERA5T data netCDF new dimension expver:
hi!
CDO dows recognize the
expverdimension as a vertical level, so a split along this dimension together with the option `-reduce_dim` should work:[...]you can though just use the
vertsumoperators and keep you fingers crossed because of the nan-handling: [...]The output is very similar to your xarray solution (max diff 10^-5)hth
ralf
Hello Ralf,
Using cdo vertsum seems to be the easiest solution. Will it handle correctly missing values if some timesteps of expver=1 or expver=5 have missing values?
Thank you
RE: mix ERA5 and ERA5T data netCDF new dimension expver - Added by Ralf Mueller about 3 years ago
Well, what is the correct handling? CDO does it like this: https://code.mpimet.mpg.de/projects/cdo/embedded/index.html#x1-500001.9
So anything to compute on a missing value results in a missing value - I don't know if this is what you want. An alternative is to set them to zero before doing the summation.
does this help?
RE: mix ERA5 and ERA5T data netCDF new dimension expver - Added by François Roberge about 3 years ago
Ralf Mueller wrote in RE: mix ERA5 and ERA5T data netCDF new dimension expver:
Well, what is the correct handling? CDO does it like this: https://code.mpimet.mpg.de/projects/cdo/embedded/index.html#x1-500001.9
So anything to compute on a missing value results in a missing value - I don't know if this is what you want. An alternative is to set them to zero before doing the summation.
does this help?
Hello Ralph,
According to the documentation you point, since vertsum is a sum and considering that a specific timestep could have all values with expver=5 or 1 equal to "miss", at each time step, the result of vertsum will always be equal to the non-missing value between expver=1 and 5. Is that correct?
Thank you
RE: mix ERA5 and ERA5T data netCDF new dimension expver - Added by Ralf Mueller about 3 years ago
My interpretation of the docu is different: All summation that involves at least a single missing value will result in a missing value. Hence my assumption is, that cdo -vertsum might result in everything being set to missing value.
Obviously I am wrong ;-)
I would double check the month of the results of the vertsum operation with the result of the splitlevel call. just to be sure here:
% cdo -s -infov -monmean -vertsum DE_t2m_2019_01.nc
    -1 :       Date     Time   Level Gridsize    Miss :     Minimum        Mean     Maximum : Parameter name
     1 : 2019-01-16 11:30:00       0       81       0 :      273.75      274.30      274.84 : t2m
     2 : 2019-02-14 23:30:00       0       81       0 :      277.11      277.54      278.04 : t2m
     3 : 2019-03-16 11:30:00       0       81       0 :      279.39      280.08      280.69 : t2m
     4 : 2019-04-15 23:30:00       0       81       0 :      282.36      283.61      284.35 : t2m
     5 : 2019-05-16 11:30:00       0       81       0 :      284.58      285.43      286.11 : t2m
     6 : 2019-06-15 23:30:00       0       81       0 :      293.20      295.10      296.31 : t2m
     7 : 2019-07-16 11:30:00       0       81       0 :      291.16      292.58      293.52 : t2m
     8 : 2019-08-16 11:30:00       0       81       0 :      292.34      293.68      294.51 : t2m
     9 : 2019-09-15 23:30:00       0       81       0 :      287.10      287.98      288.53 : t2m
    10 : 2019-10-16 11:30:00       0       81       0 :      283.50      284.35      285.07 : t2m
    11 : 2019-11-15 23:30:00       0       81       0 :      278.87      279.36      279.96 : t2m
    12 : 2019-12-16 11:30:00       0       81       0 :      277.01      277.35      277.79 : t2m

% cdo -s -infov -monmean DE_t2m_2019_split000001.nc
    -1 :       Date     Time   Level Gridsize    Miss :     Minimum        Mean     Maximum : Parameter name
     1 : 2019-01-16 11:30:00       0       81       0 :      273.75      274.30      274.84 : t2m
     2 : 2019-02-14 23:30:00       0       81       0 :      277.11      277.54      278.04 : t2m
     3 : 2019-03-16 11:30:00       0       81       0 :      279.39      280.08      280.69 : t2m
     4 : 2019-04-15 23:30:00       0       81       0 :      282.36      283.61      284.35 : t2m
     5 : 2019-05-16 11:30:00       0       81       0 :      284.58      285.43      286.11 : t2m
     6 : 2019-06-15 23:30:00       0       81       0 :      293.20      295.10      296.31 : t2m
     7 : 2019-07-16 11:30:00       0       81       0 :      291.16      292.58      293.52 : t2m
     8 : 2019-08-16 11:30:00       0       81       0 :      292.34      293.68      294.51 : t2m
     9 : 2019-09-15 23:30:00       0       81       0 :      287.10      287.98      288.53 : t2m
    10 : 2019-10-16 11:30:00       0       81       0 :      283.50      284.35      285.07 : t2m
    11 : 2019-11-15 23:30:00       0       81       0 :      278.87      279.36      279.96 : t2m
    12 : 2019-12-16 11:30:00       0       81      81 :                     nan             : t2m

% cdo -s -infov -monmean DE_t2m_2019_split000005.nc
    -1 :       Date     Time   Level Gridsize    Miss :     Minimum        Mean     Maximum : Parameter name
     1 : 2019-01-16 11:30:00       0       81      81 :                     nan             : t2m
     2 : 2019-02-14 23:30:00       0       81      81 :                     nan             : t2m
     3 : 2019-03-16 11:30:00       0       81      81 :                     nan             : t2m
     4 : 2019-04-15 23:30:00       0       81      81 :                     nan             : t2m
     5 : 2019-05-16 11:30:00       0       81      81 :                     nan             : t2m
     6 : 2019-06-15 23:30:00       0       81      81 :                     nan             : t2m
     7 : 2019-07-16 11:30:00       0       81      81 :                     nan             : t2m
     8 : 2019-08-16 11:30:00       0       81      81 :                     nan             : t2m
     9 : 2019-09-15 23:30:00       0       81      81 :                     nan             : t2m
    10 : 2019-10-16 11:30:00       0       81      81 :                     nan             : t2m
    11 : 2019-11-15 23:30:00       0       81      81 :                     nan             : t2m
    12 : 2019-12-16 11:30:00       0       81       0 :      277.01      277.35      277.79 : t2m
looks good to me ;-)
RE: mix ERA5 and ERA5T data netCDF new dimension expver - Added by François Roberge about 3 years ago
Ralf Mueller wrote in RE: mix ERA5 and ERA5T data netCDF new dimension expver:
My interpretation of the docu is different: All summation that involves at least a single missing value will result in a missing value. Hence my assumption is, that
cdo -vertsummight result in everything being set to missing value.Obviously I am wrong ;-)
I would double check the month of the results of the
vertsumoperation with the result of thesplitlevelcall. just to be sure here:[...]
looks good to me ;-)
Hello Ralf,
Yes it does look good.
However, I thought that by looking at the table, it is the "addition" that with a non-missing and b missing, that a + b = missing and that the sum would result in a + b = a.
Thank you
RE: mix ERA5 and ERA5T data netCDF new dimension expver - Added by Ralf Mueller about 3 years ago
these tables a bit hard to understand IMO - they say: if a and b are non-missing values, the results is a+b. first column represents possible values of the first element of the summation, first row possible values of the second. a and b stand for normal numeric values, miss for missing values.
The pdf version uses colored cells to indicate this ( https://code.mpimet.mpg.de/projects/cdo/embedded/cdo.pdf page 25)
RE: mix ERA5 and ERA5T data netCDF new dimension expver - Added by François Roberge about 3 years ago
Ralf Mueller wrote in RE: mix ERA5 and ERA5T data netCDF new dimension expver:
these tables a bit hard to understand IMO - they say: if a and b are non-missing values, the results is a+b. first column represents possible values of the first element of the summation, first row possible values of the second. a and b stand for normal numeric values, miss for missing values.
The pdf version uses colored cells to indicate this ( https://code.mpimet.mpg.de/projects/cdo/embedded/cdo.pdf page 25)
Hello Ralph,
Yes exactly. If the first column represent the possible values of the first element of the summation and first row possible values of the second, then if the first element is equal to "a" and the second is equal to "miss", the result of the summation is a.
For the addition, if the first element is equal to "a" and the second one is equal to "miss" then the result is "miss".
Is that correct?
Thank you
RE: mix ERA5 and ERA5T data netCDF new dimension expver - Added by Ralf Mueller about 3 years ago
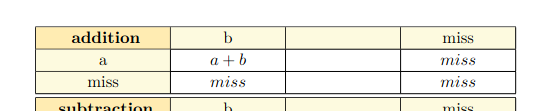
White cells hold result values, yellow cells are input values for the addition:
a + miss = miss
miss + b = miss
RE: mix ERA5 and ERA5T data netCDF new dimension expver - Added by François Roberge about 3 years ago
Ralf Mueller wrote in RE: mix ERA5 and ERA5T data netCDF new dimension expver:
White cells hold result values, yellow cells are input values for the addition:
a + miss = miss
miss + b = miss

Hello Ralf,
For the addition, yes I agree with you.
But for the summation : a + miss = a
Thank you,
François
RE: mix ERA5 and ERA5T data netCDF new dimension expver - Added by Ralf Mueller about 3 years ago
sry (again). you are absolutely right. summation behaves like it is most usable for most people. That's why CDO also has mean and avg values. I forgot about the addition vs summation thing - my bad
RE: mix ERA5 and ERA5T data netCDF new dimension expver - Added by François Roberge about 3 years ago
Ralf Mueller wrote in RE: mix ERA5 and ERA5T data netCDF new dimension expver:
sry (again). you are absolutely right. summation behaves like it is most usable for most people. That's why CDO also has
meanandavgvalues. I forgot about the addition vs summation thing - my bad
Hello Ralph,
Thank you. I am glad we were able to sort it out.
François