Trends with cdo python bindings
Added by Neil Swart about 11 years ago
Hello,
I can return masked arrays to python when doing most cdo operations, eg:
var = cdo.timmean(input=ifile, returnMaArray='slp')However, when trying to do operations that require two output fields, I'm not sure what to do, eg:
var = cdo.trend(input=ifile, returnMaArray='slp', returnMaArray='slp')
cdo trend (Abort): Too few streams specified! Operator needs 1 input and 2 output streams.
I've tried many different variations, including assigning to a tuple etc, but with no luck. Does anyone know how this is done?
thanks,
Neil
Replies (6)
RE: Trends with cdo python bindings - Added by Ralf Mueller about 11 years ago
Hi Niel!
the current implementation of the python bindings do not support direct return of numpy-like arrays for multiple output files. Sorry, I didn't cover this.
Do get the values, you could save both ouput files and read them in with cdo sequentially.
If you want, you can upload you input so that I can play arraound with it.
thanks for hint!
ralf
RE: Trends with cdo python bindings - Added by Neil Swart about 11 years ago
thanks Ralf,
I took the option of saving to two files and then reading in, which works fine. I see that adding the ability to return arrays is on the list at gihub.
Thanks for all your work on this - I find the bindings very useful.
-Neil
RE: Trends with cdo python bindings - Added by Bérénice Ferrand almost 4 years ago
Hi Neil !
Can I know how do you do to read a plot with your data and the trend curve ? I don't manage to do that because of the 2 infiles.
Thanks
Bérénice
RE: Trends with cdo python bindings - Added by Karin Meier-Fleischer almost 4 years ago
Hi Bérénice,
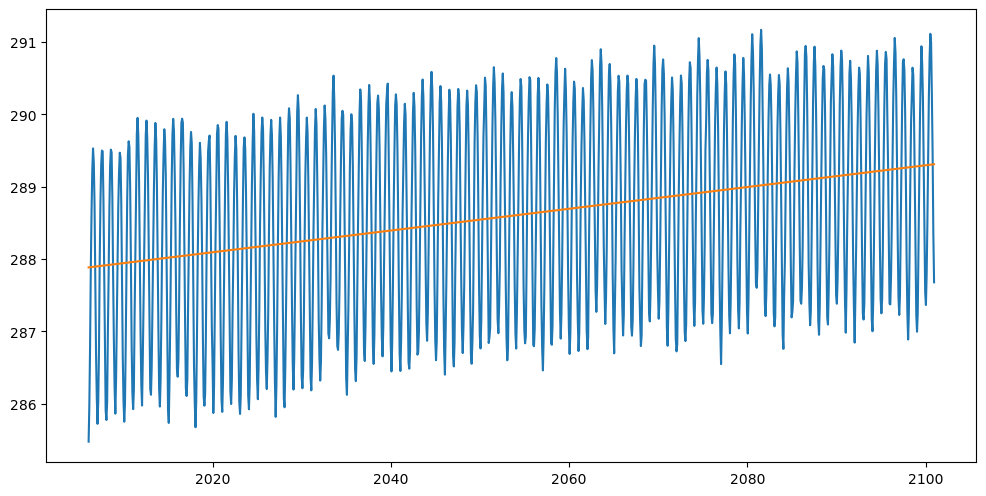
here is an example script that computes the trend and plots the data and trend in same plot.
import matplotlib.pyplot as plt
from cdo import *
cdo = Cdo()

infile = 'tas_Amon_MPI-ESM-LR_rcp45_r1i1p1_200601-210012.nc'

ds = cdo.fldmean(input=infile, returnXDataset='tas')

tas = ds.tas.squeeze()

ds_a, ds_b = cdo.trend(input='-fldmean '+infile, returnXDataset='tas')

a = ds_a.tas[:,0,0].values[0]
b = ds_b.tas[:,0,0].values[0]
print('a =',a,'  b =',b)

trend_data = tas.copy()
for i in range(0,len(tas)):
    trend_data[i] = a+(b*i)

fig = plt.figure(figsize=(12,6))
ax = fig.add_subplot(111)
ax.plot(ds.time, tas.values)
ax.plot(ds.time, trend_data)
plt.savefig('plot_trend_cdo.png', bbox_inches='tight', facecolor='white', dpi=100)
-Karin
| plot_trend_cdo.png (147 KB) plot_trend_cdo.png |
RE: Trends with cdo python bindings - Added by Bérénice Ferrand almost 4 years ago
Thanks you ! I succeed to adapt to my code and to my data and it is working !
I have an other question, it is just for the "style" :
How do you add a label to individually label each curve? I tried the following lines but it doesn't work, maybe I'm not using the right arguments, I also tried with 'ylabel'
ax.plot(ds.time, tos.values, color='b', linewidth=2., linestyle='-', alpha=1., label='Temperature')
#ax.set_ylabel(ylabel='Temperature')
ax.plot(ds.time, trend_data, color='r', linewidth=2., linestyle='-', alpha=1., label='Trend')
RE: Trends with cdo python bindings - Added by Karin Meier-Fleischer almost 4 years ago
You can add a legend
ax.legend()
or add a label as annotation (https://matplotlib.org/stable/gallery/index.html#text-labels-and-annotations).