convert netcdf file from polar stereographic to lat/lon
Added by Micheal Simpson over 3 years ago
I have not been using cdo long, but it seems to be exactly what I need to get the desired result --> remap polar radar data to a regular lat/lon grid.
I have a dataset (attached) that contains radial radar data with dimensions 720(azimuth) x 4320 (gates). I try to do a basic remap command such as:
cdo remapbil,r360x180 tmp.netcdf out.nc
And get the error:
cdo remapbil (Abort): Unsupported generic coordinates (Variable: ReflectivityQC)!
Reading some of the previous forums, it would seem this is an issue with the coordinates of my variable ReflectivityQC but I am not 100% sure how to fix this so that I can begin to remap.
Once this is fixed, I would like to remap this polar stereographic dataset to a latlon grid with user-defined resolution of lat/lon while also defining the grid limits to constrain the dataset. For example:
Ex1) 0.01-degree grid-spacing grid between lat = [30,40] and lon = [-90,-80]
Ex2) 0.005-degree grid-spacing grid between lat = [40,45] and lon = [-110,-100]
What would be the best way of achieving this?
| tmp.netcdf (23.8 MB) tmp.netcdf | netcdf file containing data for the current question |
Replies (27)
RE: convert netcdf file from polar stereographic to lat/lon - Added by Micheal Simpson over 3 years ago
I will also mention that I have been able to plot this data using pyproj via the following (in Python):
x = range * np.sin(numpy.deg2rad(azimuth))[:,None]
y = range * np.cos(numpy.deg2rad(azimuth))[:,None]
- Setup a projection
dataproj = Proj(f"+proj=stere +lat_0={latitude} +lat_ts={latitude} +lon_0={longitude} +ellps=WGS84 +units=m")
lons,lats = dataproj(x,y,inverse=True)
RE: convert netcdf file from polar stereographic to lat/lon - Added by Estanislao Gavilan over 3 years ago
Hi Micheal,
the coordiantes attribute missing in your variable. Ralph posted a few days ago something about this. So I am going to copy and paste his solution
cdo remapbil,r360x180 -setattribute,ReflectivityQC@coordinates="range azimuth" tmp.netcdf out.nc
You can try this. About the second thing. You need to play with the flag sellonlatbox,lon1,lon2,lat1,lat2.It might look something like this
cdo -sellonlatbox,lon1,lon2,lat1,lat2 remapbil,r360x180 -setattribute,ReflectivityQC@coordinates="range azimuth" tmp.netcdf out.nc
The third part I am not sure. I do not use the flags r360x180. I always use grid.txt file.
Regards,
Estanislao
RE: convert netcdf file from polar stereographic to lat/lon - Added by Micheal Simpson over 3 years ago
Thank you for the reply.
I get the same error message when I try the following:
cdo remapbil,r360x180 -setattribute,ReflectivityQC@coordinates="range azimuth" tmp.netcdf out.nc
cdo(1) setattribute: Process started
cdo remapbil (Abort): Unsupported generic coordinates (Variable: ReflectivityQC)!
I should elaborate moreso that the 'range' variable is the range from the radar in meters, and the 'azimuth' is the bearing direction from the radar in degrees (not radians). Therefore, I do not explicitly state the lat/lon grid within the netcdf file. I can however convert the data via the projection I mentioned above:
x = range * np.sin(numpy.deg2rad(azimuth))[:,None]
y = range * np.cos(numpy.deg2rad(azimuth))[:,None]
dataproj = Proj(f"+proj=stere +lat_0={latitude} +lat_ts={latitude} +lon_0={longitude} +ellps=WGS84 +units=m")
lons,lats = dataproj(x,y,inverse=True)
I create a meshgrid of lats/lons. The examples that I have found thus far seem to only provide 1D values for latitude and/or longitude. Therefore, can cdo remap with a 2D lat/lon grid of values?
RE: convert netcdf file from polar stereographic to lat/lon - Added by Karin Meier-Fleischer over 3 years ago
May I weigh in here. It took some time to find a way to compute the lonlats from the radar data. I can recommend to use the Python Py-Art package (The Python ARM Radar Toolkit, Py-ART, is a Python module containing a collection of weather radar algorithms and utilities).
The solution is Python only.
#!/usr/bin/env python

import os
import pyart
import xarray as xr
import numpy as np

# Read the radar data from the given file.

infile = os.environ['HOME'] + '/Downloads/tmp.netcdf'

ds = xr.open_dataset(infile)

# Copy the input data and add _FillValue/missing_value attributes.

data = ds.ReflectivityQC.copy()

data.attrs = {'_FillValue':-999.,
               'missing_value':-999.}

# Define the x,y dimension arrays for the curvilinear grid (longitude(y,x), latitude(y,x)).

y = np.arange(0, ds.azimuth.shape[0])
x = np.arange(0, ds.range.shape[0])

# Create the radar ppi object from the input data. Compute the longitude and latitude values with the Py-Art functions init_gate_altitude() and init_gate_longitude_latitude().

radar = pyart.testing.make_empty_ppi_radar(ds.range.shape[0], ds.azimuth.shape[0],1)

radar.latitude['data'] = np.array([float(ds.latitude.values)])
radar.longitude['data'] = np.array([float(ds.longitude.values)])
radar.range['range'] = np.array(ds.range)
radar.azimuth['data'] = np.array(ds.azimuth.values)
radar.sweep_number['data'] = np.array([float(ds.sweep_number.values)])
radar.sweep_start_ray_index['data'] = np.array([float(ds.sweep_start_ray_index)])
radar.sweep_end_ray_index['data'] = np.array([float(ds.sweep_end_ray_index)])
radar.fixed_angle['data'] = np.array(ds.fixed_angle)
radar.altitude['data'] = np.array([float(ds.altitude)])
radar.elevation['data'] = np.array(ds.fixed_angle) * len(ds.azimuth)

radar.init_gate_altitude()
radar.init_gate_longitude_latitude()

# Assign the coordinate data arrays.

lat = xr.DataArray(radar.gate_latitude['data'].copy(), coords=[y,x], dims=['y', 'x'])
lat.attrs = {'units': radar.gate_latitude['units'],
             'standard_name': 'latitude'}

lon = xr.DataArray(radar.gate_longitude['data'].copy(), coords=[y,x], dims=['y', 'x'])
lon.attrs = {'units': radar.gate_longitude['units'],
             'standard_name': 'longitude'}

# Create new dataset for the radar data and its curvilinear coordinates.

ds_new = xr.Dataset()
ds_new['ReflectivityQC']   = (('y','x'), data.data, data.attrs)
ds_new.coords['latitude']  = (('y','x'), lat.data, lat.attrs)
ds_new.coords['longitude'] = (('y','x'), lon.data, lon.attrs)
ds_new.attrs['history']    = 'DKRZ Tutorial example: radar data conversion'

# Write the new dataset to a netCDF output file.

outfile = 'radar_data_lonlat.nc'

ds_new.to_netcdf(outfile)
The ncdump output for the new netCDF file:
ncdump -h radar_data_lonlat.nc
netcdf radar_data_lonlat {
dimensions:
    y = 720 ;
    x = 4320 ;
variables:
    double ReflectivityQC(y, x) ;
        ReflectivityQC:_FillValue = -999. ;
        ReflectivityQC:missing_value = -999. ;
        ReflectivityQC:coordinates = "latitude longitude" ;
    double latitude(y, x) ;
        latitude:_FillValue = NaN ;
        latitude:units = "degrees_east" ;
        latitude:standard_name = "latitude" ;
    double longitude(y, x) ;
        longitude:_FillValue = NaN ;
        longitude:units = "degrees_north" ;
        longitude:standard_name = "longitude" ;

// global attributes:
        :history = "DKRZ Tutorial example: radar data conversion" ;
}
And CDO can handle the new file:
cdo sinfon radar_data_lonlat.nc
   File format : NetCDF4
    -1 : Institut Source   T Steptype Levels Num    Points Num Dtype : Parameter name
     1 : unknown  unknown  c instant       1   1   3110400   1  F64  : ReflectivityQC
   Grid coordinates :
     1 : curvilinear              : points=3110400 (4320x720)
                        longitude : -80.03296 to -80.01074 degrees_north
                         latitude : 35.92496 to 35.94294 degrees_east
   Vertical coordinates :
     1 : surface                  : levels=1
RE: convert netcdf file from polar stereographic to lat/lon - Added by Micheal Simpson over 3 years ago
Thanks for the reply Karin,
Unfortunately, those lat/lon points do not seem to match up with where my grid is. I have adapted some of the code and revamped it into a working output netcdf file as below:
#!/usr/bin/python3
import os
import sys
import pathlib
import numpy as np
from pyproj import Proj
from netCDF4 import Dataset
- Extract_single_variable function simply gets the netcdf 'data' with the desired variable as the second argument.
zh = extract_single_variable(data,'DBZH'); zh_dict = {}; qc_zh = {};
latitude = extract_single_variable(data,'latitude')
longitude = extract_single_variable(data,'longitude')
rangee = extract_single_variable(data,'range')
az_all = extract_single_variable(data,'azimuth'); az_dict = {};
sweep_start = extract_single_variable(data,'sweep_start_ray_index')
sweep_end = extract_single_variable(data,'sweep_end_ray_index')
sweep_num = extract_single_variable(data,'sweep_number')
- Loop through the number of sweeps
for i in sweep_num:
zh_dict[i] = zh[sweep_start[i]:sweep_end[i]+1];
az_dict[i] = az_all[sweep_start[i]:sweep_end[i]+1]
- Now loop through each of the tilts to qc everything
for tiltnum in range(0,len(az_dict)):
az = az_dict[tiltnum]
zh_tilt = zh_dict[tiltnum]
- Now we will try to convert from polar to cartesian so we can plot easily
x = rangee * np.sin(np.deg2rad(az_dict0))[:,None]
y = rangee * np.cos(np.deg2rad(az_dict0))[:,None]
- Setup a projection
dataproj = Proj(f"+proj=eqc +lat_0={latitude} +lat_ts={latitude} +lon_0={longitude} +ellps=WGS84 +units=m")
lons,lats = dataproj(x,y,inverse=True)
- Output a netcdf file
full_outfile = 'test.nc'
- Start with the netcdf filename and all the good stuff
ncfile = Dataset(full_outfile,mode='w',format='NETCDF4_CLASSIC')
print(z.shape)
- Add the dimensions of our data, lat, and lons.
ncfile.createDimension('y',((x.shape0)))
ncfile.createDimension('x',((x.shape1)))
- Now we want to add the data
datavar = ncfile.createVariable('Reflectivity',np.float64,(('y','x')))
datavar[:,:] = z
datavar.coordinates = "longitude latitude"
- And then add the latitude
datalat = ncfile.createVariable('latitude',np.float64,(('y','x')))
datalat[:,:] = lats
datalat.standard_name = 'latitude'
datalat.units = 'degrees_east'
- And then add the longitude
datalon = ncfile.createVariable('longitude',np.float64,(('y','x')))
datalon[:,:] = lons
datalon.standard_name = 'longitude'
datalon.units = 'degrees_north'
- Close the netcdf file
ncfile.close()
Attached is the output in 'test.nc', which outputs the following:
cdo sinfon test.nc py nexrad
File format : NetCDF4 classic
-1 : Institut Source T Steptype Levels Num Points Num Dtype : Parameter name
1 : unknown unknown c instant 1 1 3110400 1 F64 : Reflectivity
Grid coordinates :
1 : curvilinear : points=3110400 (4320x720)
longitude : -81.51942 to -78.52428 degrees_north
latitude : 34.72137 to 37.14652 degrees_east
Vertical coordinates :
1 : surface : levels=1
cdo sinfon: Processed 1 variable [0.06s 83MB].
So this is great. So I try to run the following code:
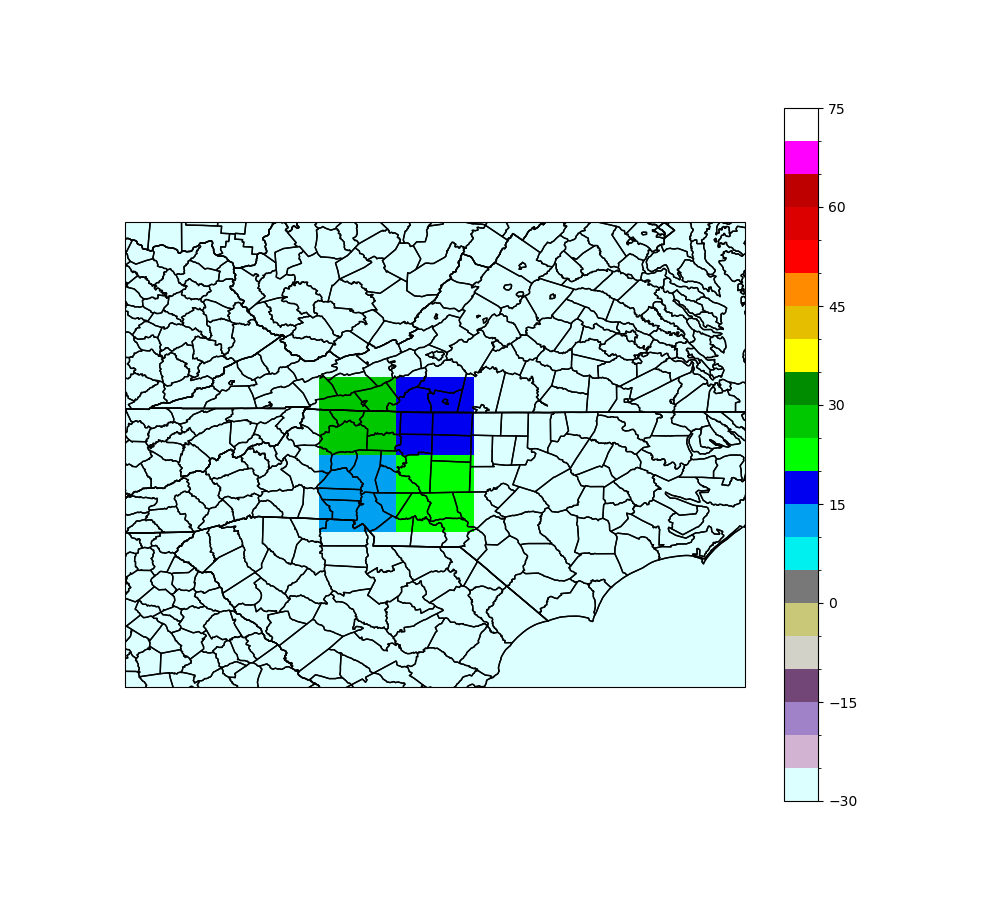
cdo remapbil,r360x180 test.nc out.nc
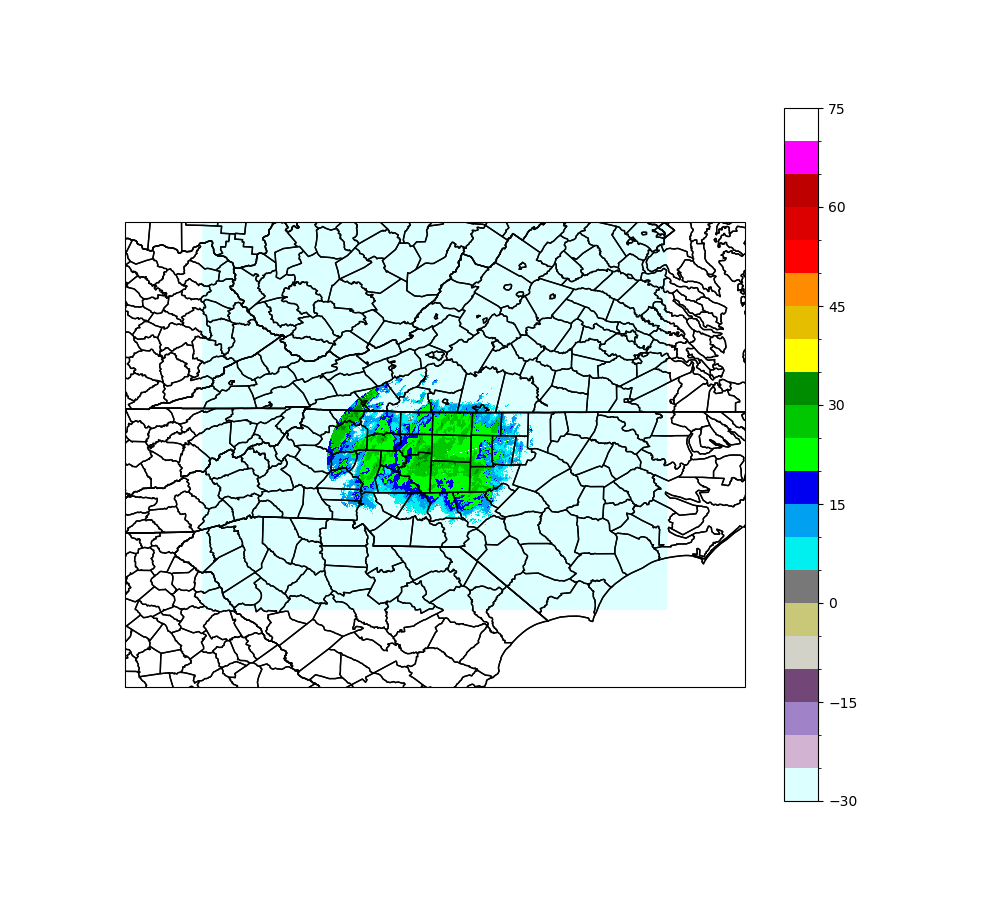
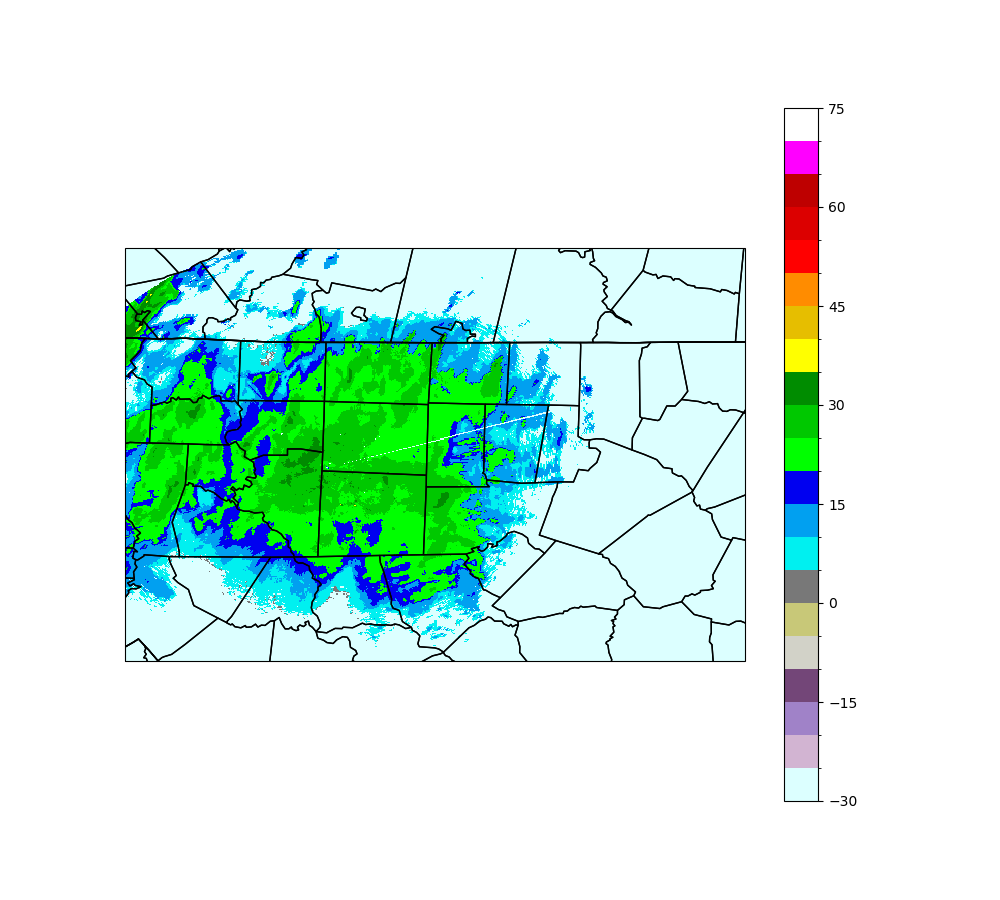
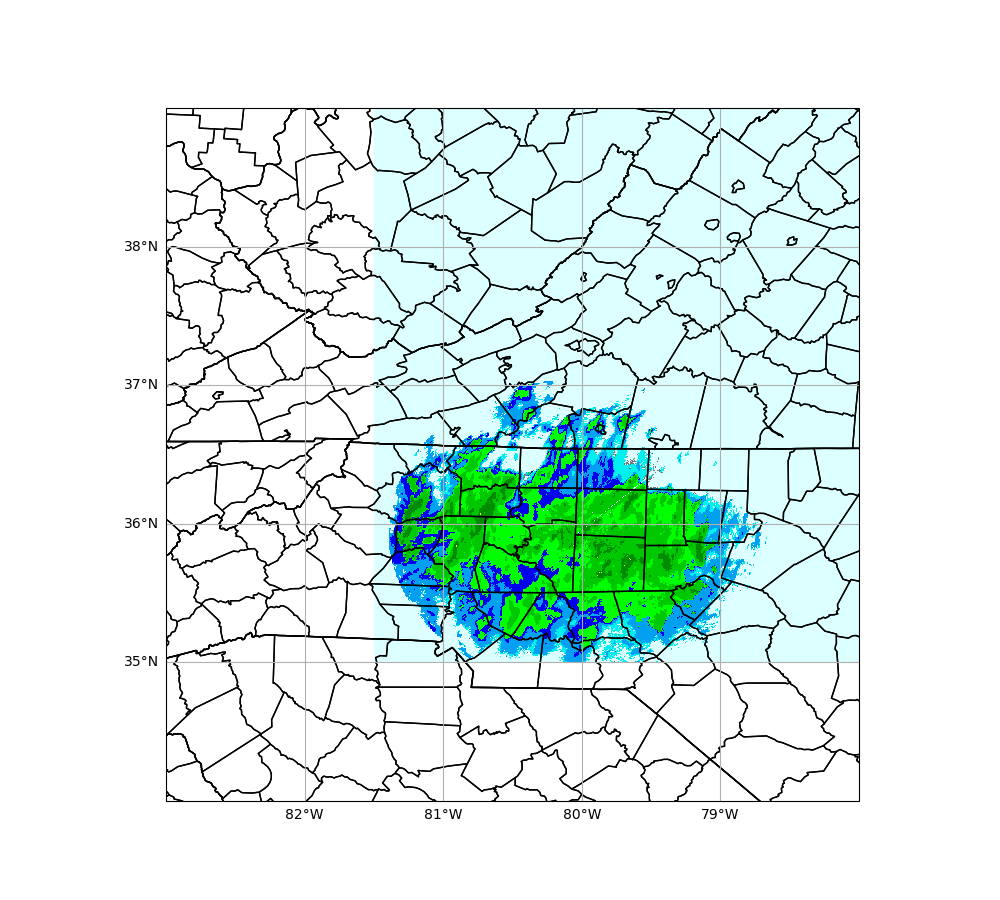
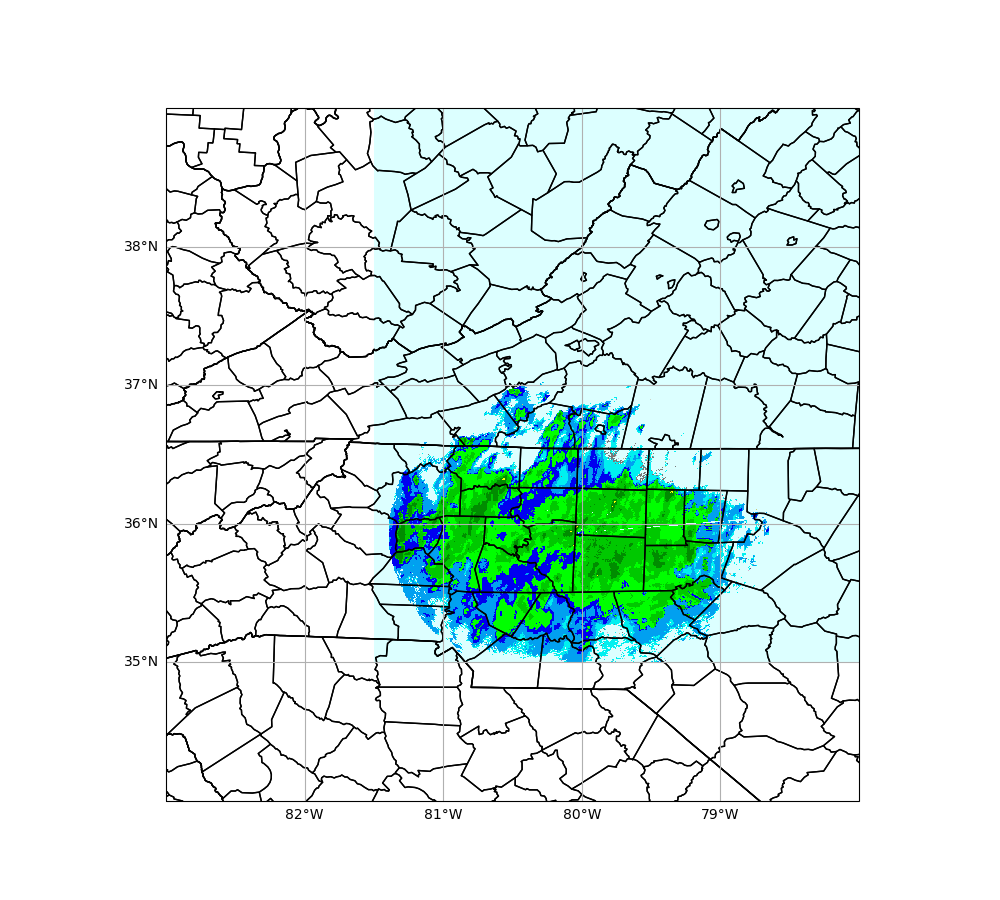
I am also attaching out.nc and an image of out.nc. This is obviously not how I would like the data to look. So I tried another code:
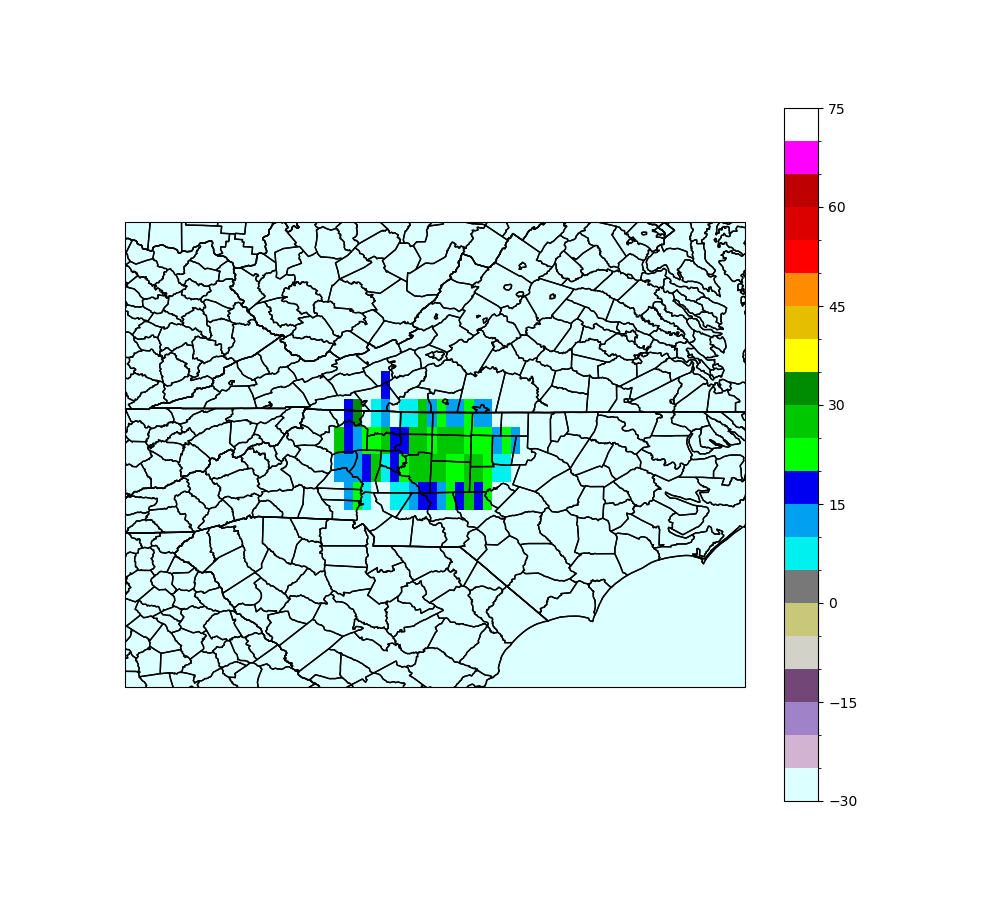
cdo remapbil,r3000x500 test.nc out2.nc
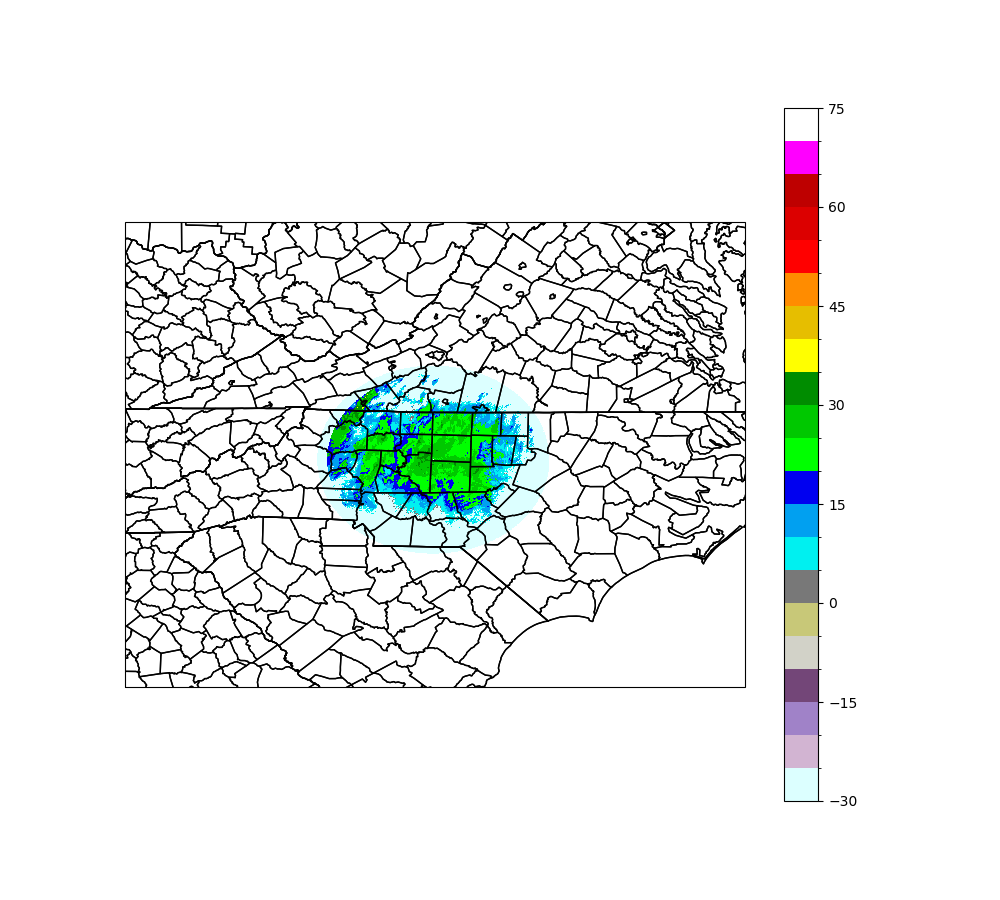
where I am attaching the image from out2.nc. I am further attaching the output of what the data should look like with no interpolation (i.e., what it looks like when I plot the data regularly) - i.e. the output from test.nc. Now that I have a working netcdf file with good looking data that cdo can read, all that is left is to know how to:
1) remap the grid to a desired lat/lon domain (e.g., 0.01-degrees, 0.005-degrees, etc.). Estanislao helped by mentioning the 'sellonlatbox' functions which is very helpful. Therefore, the only thing really potentially left is:
2) remap the grid to a desired lat/lon resolution. For example, 0.01-degree spacing, 0.005-degree spacing, etc.
RE: convert netcdf file from polar stereographic to lat/lon - Added by Estanislao Gavilan over 3 years ago
Hi Micheal,
I think this is almost wrapped it up. If you use the grid.text that I attached you, you can get Figure 1. You will have to edit it to change the xsize,ysize, xinc and yinc for the 0.0005 resolution. There are a few things that you will also need to consider. I noticed that your missvalue is -32768. Therefore you should write -setmissval,-32768 before the remapbil command. There is also the problem of the discontinuity that appears in the figure. I am not sure how to duplicate the last column in cdo, but I am sure our admins or Brendan can help you with this.
cdo -z zip_6 -remapbil,grid_Michael.txt -setmissval,-32768 test.nc out.ncPS:you do not need to use the zip for compression. I always use it to save up memory
| Figure1.png (395 KB) Figure1.png | |||
| grid_Michael.txt (132 Bytes) grid_Michael.txt | |||
| out.nc (22 MB) out.nc |
RE: convert netcdf file from polar stereographic to lat/lon - Added by Karin Meier-Fleischer over 3 years ago
Hi Michael,
It's always hard when you're in the dark, especially when you have no region clues to check.
Unfortunately you also used another input file (variable DBZH instead of RefectivityQC), so I have no way to find an explanation for the wrong lonlats calculation of Py-Art.
Is it possible to get the actual file and the full script so I can see what else Py-Art needs? You can upload it here or send it to meier-fleischer@dkrz.de. I want to give Py-Art a try.
RE: convert netcdf file from polar stereographic to lat/lon - Added by Micheal Simpson over 3 years ago
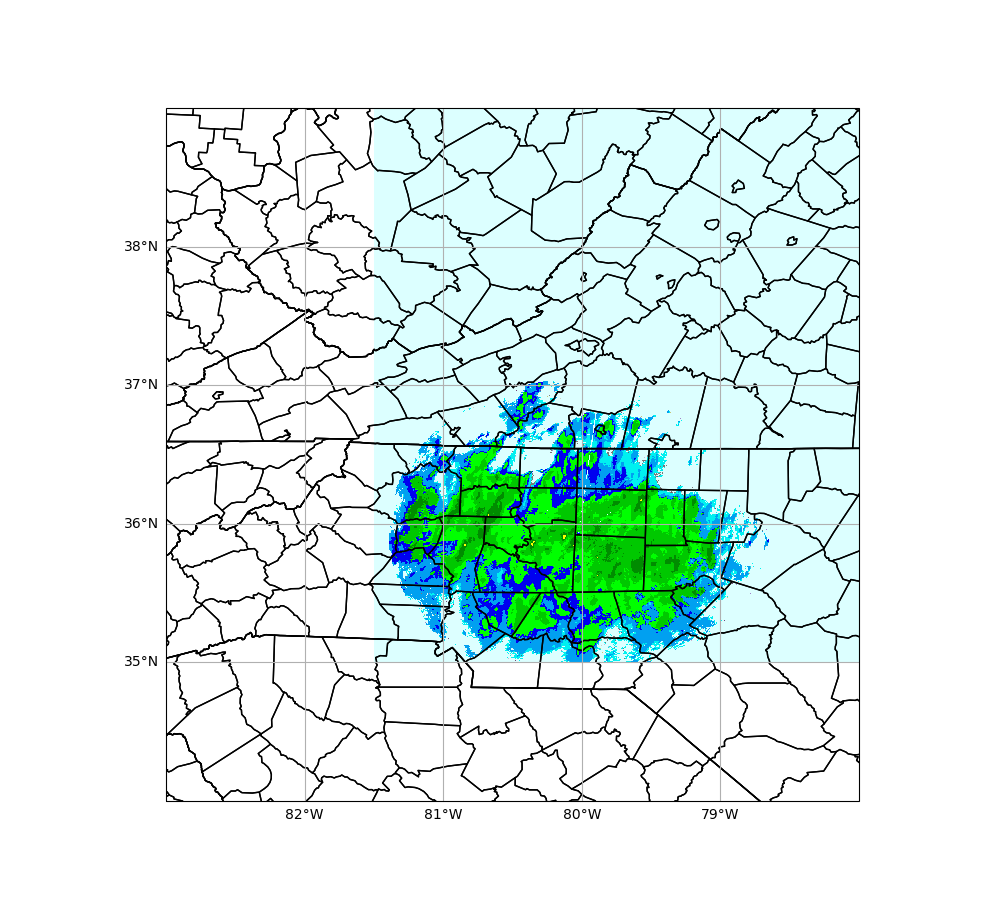
Estanislao,
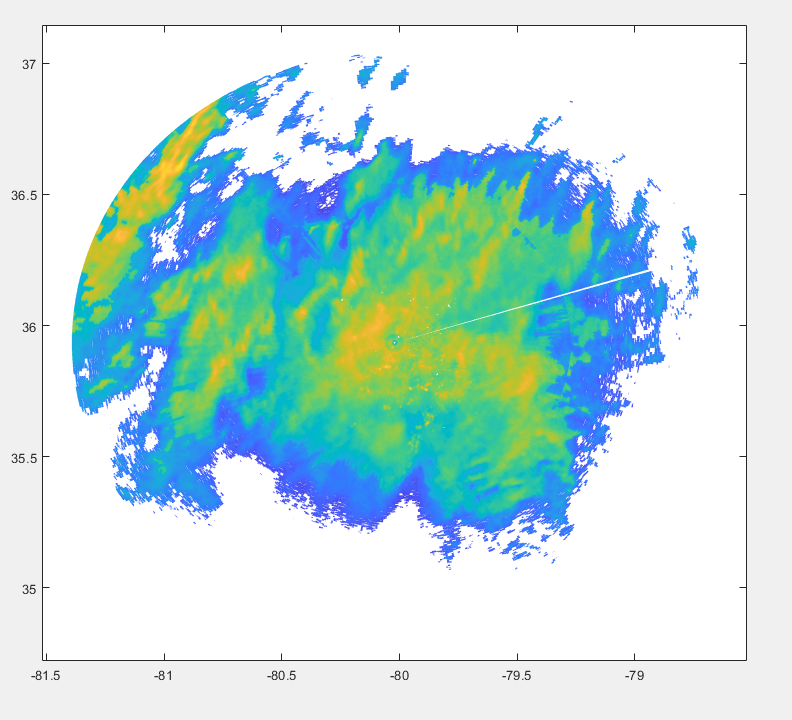
Thank you for the command - I am able to utilize this and create an output file that looks similar to what you have - including the missing radial of information which is interesting. You can see that 'fig3.png' from my previous message does not have that missing radial. But the new image I have attached 'fig4.png' does. You can also clearly see the outline of the domain in the light blue in fig4.png, but you need to zoom in somewhat to see the missing radial within the data. Getting this resolved would most likely get me the final answer needed!
Karin,
If you use the 'test.netcdf' file I originally provided to this thread, you can use pyart among other packages to plot the data (fig3.png above) with the script (original_code_to_plot.py). I also have the code which I revamp the data into a netcdf file that cdo can utilize as 'original_code_to_make_netcdf.py'.
Within both scripts, there is a section of code where I use pyproj to get the lat/lons:
x = rangee * np.sin(np.deg2rad(az_dict0))[:,None]
y = rangee * np.cos(np.deg2rad(az_dict0))[:,None]dataproj = Proj(f"+proj=eqc +lat_0={latitude} +lat_ts={latitude} +lon_0={longitude} +ellps=WGS84 +units=m")
lons,lats = dataproj(x,y,inverse=True)
This is where I get the correct lat/lons which I then use to output to the netcdf file which I can then use with cdo. I am providing the code that you utilized in pyart to get the lat/lons which did not seem to output correctly as 'pyart_convert_lat_lons.py'
If I can provide any other information please let me know. I greatly appreciate all of the help.
RE: convert netcdf file from polar stereographic to lat/lon - Added by Karin Meier-Fleischer over 3 years ago
Hi Michael,
the problem in my Py-Art script was a typo in the definition of radar1.range['data']. Now it works as expected without pyproj. BTW, I added the remapping of the data to a 0.05° lonlat grid with python-cdo at the end of the script. 
Sorry, but I'm used to work with xarray instead of netcdf4.
RE: convert netcdf file from polar stereographic to lat/lon - Added by Micheal Simpson over 3 years ago
This is very helpful Karin - many thanks!
However, I still seem to get the radial of blank data (attached: fig5.png) which isn't evident in the original data (fig3.png). It is hard to see but if you zoom in to the NE, it becomes more evident. 'Figure1.png' provided by Estanislao shows this better, as well as a zoomed in fig6.png, attached. It eventually goes away if the grid-spacing is coarse enough (0.05), but that makes the data blocky and unrealistic with too much interpolating.
Just as a reference, the radar gate spacing is ~ 30m, so a 0.05-degree lat/lon spacing would yield about (111km * 0.05 ~ 5km) which is fairly coarse. Therefore, a 0.001-degree lat/lon spacing would yield ~ 100m resolution which is much more ideal.
RE: convert netcdf file from polar stereographic to lat/lon - Added by Estanislao Gavilan over 3 years ago
Hi Michael,
if you take a close look, you will also see a blank point in the center of the grid. This is something that usually happens after interpolating data from polar coordinates. You can readly correct it by python -python is always there when you most need it!!. You just need to copy the first column next to the last column, and you will close the circle. If you want to remove the small tiny blank from the center, you can use linear interpolation -once more python will rescue you form your dire moments!. I am pretty sure that cdo can cycle (i.e. add an extra column) you radial data, but I do not know how.
RE: convert netcdf file from polar stereographic to lat/lon - Added by Micheal Simpson over 3 years ago
Estanislao,
The hole in the center is from the radar itself (the blind region), so this is expected. Although it is a little more pronounced, nothing that can't be fixed like you mentioned!
I used np.insert(lons,len(lons),lons0,axis=0) along with the lats, and data, and that seemed to do the trick.
I greatly appreciate yours / Karin's help. I think this is everything I need!
-Micheal
RE: convert netcdf file from polar stereographic to lat/lon - Added by Micheal Simpson over 3 years ago
I cannot seem to find a 'delete' option in these forums, but adding the first column onto the end (even doing this 2x or 3x) did not do the trick - I was looking at the wrong file unfortunately when I posted.
I also tried to put the end data at the beginning to try and 'close the circle' as best as possible:
np.insert(lons,len(lons),lons0,axis=0)
np.insert(lons,0,lons[-2],axis=0)
Therefore, the spike is still present.
RE: convert netcdf file from polar stereographic to lat/lon - Added by Estanislao Gavilan over 3 years ago
Hi Michael,
I think there is a bug. If I cycle the grid, I can decrease the edge but not remove it. You can try somethign liek this in python.
filename='test.nc'
tecsv = NetCDFFile(filename)
data = np.array(tecsv.variables['Reflectivity'])
lon = np.array(tecsv.variables['longitude'])
lat= np.array(tecsv.variables['latitude'])
tecsv.close()
[Y,X]=np.shape(data)
data_t=np.zeros([Y+3,X]);lon_t=np.zeros([Y+3,X]);lat_t=np.zeros([Y+3,X])
data_t[0:Y,:]=data ; data_t[Y,:]=data[0,:]; data_t[Y+1,:]=data[1,:];data_t[Y+2,:]=data[2,:]
lon_t[0:Y,:]=lon ; lon_t[Y,:]=lon[0,:]; lon_t[Y+1,:]=lon[1,:];lon_t[Y+2,:]=lon[2,:]
lat_t[0:Y,:]=lat ; lat_t[Y,:]=lat[0,:];lat_t[Y+1,:]=lat[1,:];lat_t[Y+2,:]=lat[2,:]
ncfile = NetCDFFile('test_1.nc',mode='w',format='NETCDF4')
x_dim = ncfile.createDimension('x', X)
y_dim = ncfile.createDimension('y', Y+3)
lat_nc = ncfile.createVariable('latitude','f4',('y','x'))
lat_nc.standard_name = 'latitude'
lat_nc.long_name = 'latitude'
lat_nc.units = 'degrees_north'
lon_nc = ncfile.createVariable('longitude','f4',('y','x'))
lon_nc.standard_name = 'longitude'
lon_nc.long_name = 'longitude'
lon_nc.units = 'degrees_east'
data_nc = ncfile.createVariable('Reflectivity','f8',('y','x'),zlib=True)
data_nc.coordinates = 'latitude longitude'
lat_nc[:,:] = lat_t[:,:]
lon_nc[:,:] = lon_t[:,:]
data_nc[:,:] = data_t[:,:]
ncfile.close()
and then
cdo -z zip_6 -remapbil,grid_Michael.txt -setmissval,-32768 test_1.nc out.nc
but as I said the edge does not disappear. I also used the flag sethalo, but it did not help. Maybe, we are missing something. Lets wait for karin or ralph
Kind regards,
Estanislao
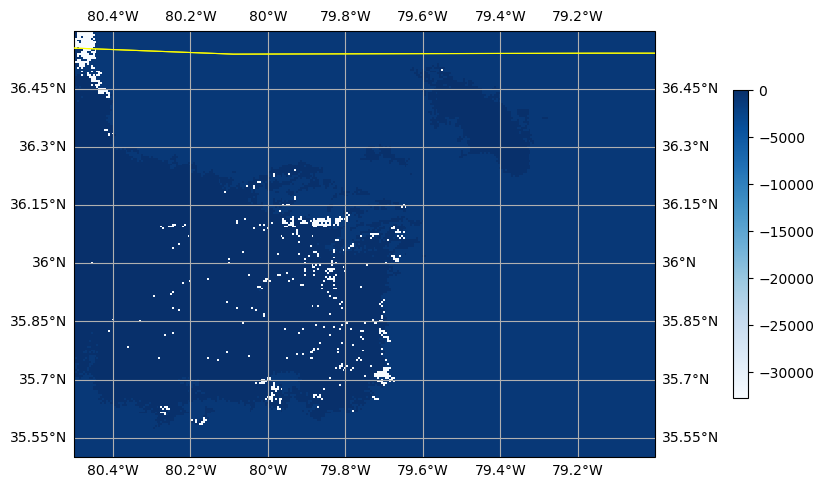
RE: convert netcdf file from polar stereographic to lat/lon - Added by Karin Meier-Fleischer over 3 years ago
I'm not able to reproduce the radial gap using the test.nc file from above. Even though zooming into the map everything looks as expected (using cdo 2.0.5 and python-cdo 1.5.7) with the Py-Art script from above. The zoom plot is added with a Blue colormap for a better view.
RE: convert netcdf file from polar stereographic to lat/lon - Added by Micheal Simpson over 3 years ago
Karin,
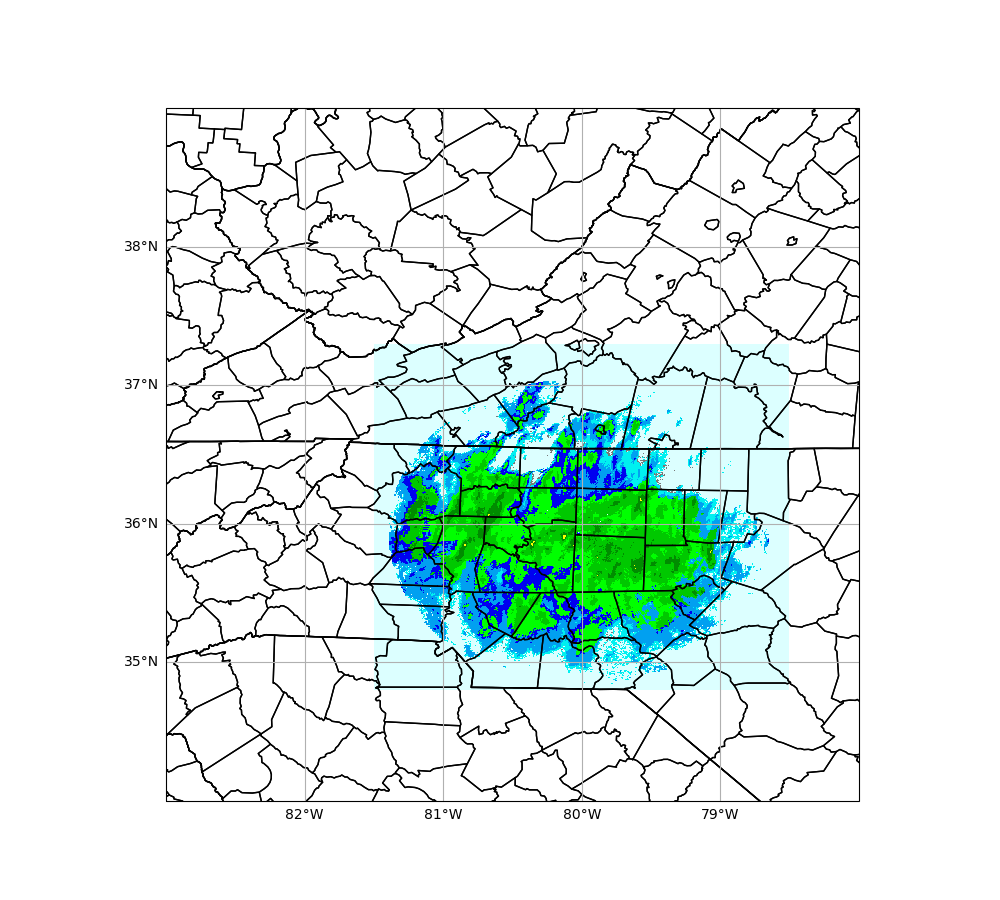
I am not sure what I am doing incorrectly, but I am still getting the spikes. I am providing 3 new images, as well as their respective netcdf files (variable = 'DBZH', not 'ReflectivityQC' like previously). These files are not qc'd, so we cannot blame any sort of goofy QC techniques arising to the spikes on the remapping with this data.
One can fairly easily see that the spike in the radial data moves in a clockwise direction as one progresses in time in the images, which most likely is the start / end of the PPI scan for this elevation angle of 0.5 degrees. I copied the exact code you provided in radar_range_azimuth_convert_to_lonlat_v2.py and ran this for each of the 3 files provided as input. This output a 'radar_data_lonlat.nc' file. Because cdo does not seem to work for python for me (from cdo import Cdo throws an error, and if I import cdo that works but says there is no model remapnn)I use the command line version of cdo (CDO version 2.0.5):
cdo -remapbil,grid.txt -setmissval,-32768 radar_data_lonlat.nc out.nc
where grid.txt is:
gridtype = lonlat
xsize = 2800
ysize = 2400
xfirst = -81.5
xinc = 0.005
yfirst = 35
yinc = 0.005
I plot the data with the following code:
fig,ax = plt.subplots(1,1, figsize=(10,9), subplot_kw=dict(projection=ccrs.PlateCarree()))
im = ax.pcolormesh(lons,lats,data)
ax.set_extent([-83,-78,34,39], ccrs.PlateCarree())
ax.add_feature(USCOUNTIES.with_scale('5m'),edgecolor='black')
ax.add_feature(USSTATES.with_scale('5m'),edgecolor='black')
gl = ax.gridlines(draw_labels=True)
gl.top_labels = False
gl.right_labels = False
plt.savefig('test1.png',dpi=100)
where lons, lats, and data = the gridded longitude, latitude, and data from the pyart script you provided. If you are unable to produce the spikes, feel free to let me know where I am likely going wrong.
| DBZH.20221001.000729.netcdf (23.8 MB) DBZH.20221001.000729.netcdf | |||
| DBZH.20221001.001135.netcdf (23.8 MB) DBZH.20221001.001135.netcdf | |||
| 000729.png (266 KB) 000729.png | |||
| 001135.png (265 KB) 001135.png | |||
| 001542.png (266 KB) 001542.png | |||
| DBZH.20221001.001542.netcdf (23.8 MB) DBZH.20221001.001542.netcdf |
RE: convert netcdf file from polar stereographic to lat/lon - Added by Karin Meier-Fleischer over 3 years ago
About Python and cdo: you have to install the wrapper package python-cdo which installs cdo too. See https://code.mpimet.mpg.de/attachments/download/27273/python_cdo_introduction.pdf.
I will have a look at the new data files this afternoon.
RE: convert netcdf file from polar stereographic to lat/lon - Added by Karin Meier-Fleischer over 3 years ago
Hm, try to use remapnn instead of remapbil. Does that fix the spikes issue?
cdo -remapnn,grid.txt -setmissval,-32768 radar_data_lonlat.nc out.nc
When I use remapbil I can reproduce the spike issue but using remapnn instead it doesn't produce a spike.
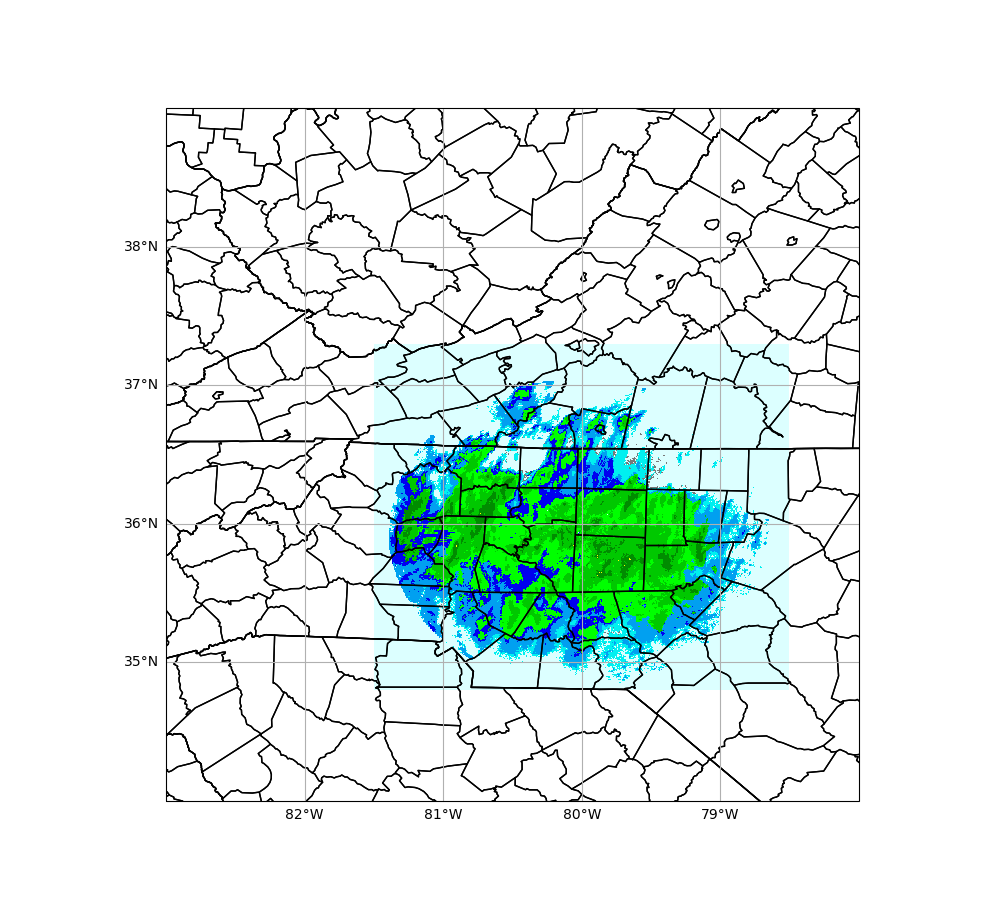
RE: convert netcdf file from polar stereographic to lat/lon - Added by Micheal Simpson over 3 years ago
I think this did the trick!
The very last question would be - is it needed to read in a text file, or can I define the 'xsize', 'xfirst', 'yinc', etc. on the command line?
| 000729_nn.png (246 KB) 000729_nn.png | |||
| 001135_nn.png (245 KB) 001135_nn.png |
RE: convert netcdf file from polar stereographic to lat/lon - Added by Karin Meier-Fleischer over 3 years ago
Good to hear that it works for you!
The remap* operators need a grid description as input where it can be the name of a pre-defined grid or a target grid description file.
RE: convert netcdf file from polar stereographic to lat/lon - Added by Micheal Simpson over 3 years ago
Thanks for the feedback Karin,
So if I were to run this remap algorithm for x number of different radars, I would need x number of text files with the grid information?
RE: convert netcdf file from polar stereographic to lat/lon - Added by Karin Meier-Fleischer over 3 years ago
Yes, you need the grid information for each radar station if you need to remap the data.
I recommend to do this in a Shell or Python script and store the grid files in a separate folder. You need to do it once per radar station.
RE: convert netcdf file from polar stereographic to lat/lon - Added by Micheal Simpson over 3 years ago
Perfect.
Many thanks for all of your help!
RE: convert netcdf file from polar stereographic to lat/lon - Added by Karin Meier-Fleischer over 3 years ago
You're welcome!
RE: convert netcdf file from polar stereographic to lat/lon - Added by Micheal Simpson over 3 years ago
Is there a way to get cdo to run in Python while also outputting the info in python? In other words, I want to call / use cdo, do some additional work on the information where cdo was implemented, and then, eventually, output to a netcdf file.
For example, the line 121 in radar_range_azimuth_convert_to_lonlat_v2.py:
cdo.remapnn(gridfile,input=' -setmissval,-999. '+outfile,output='radar_data_lonlat_0.005.nc')
If I try to do something like:
reproj = cdo.remapnn(gridfile,input=' -setmissval,-999. '+outfile,output='radar_data_lonlat_0.005.nc')
I do not get data as an output.