Normalised dataset
Added by Bérénice Ferrand almost 4 years ago
Hi !
Is it possible to normalise a dataset with cdo ?
I tried :
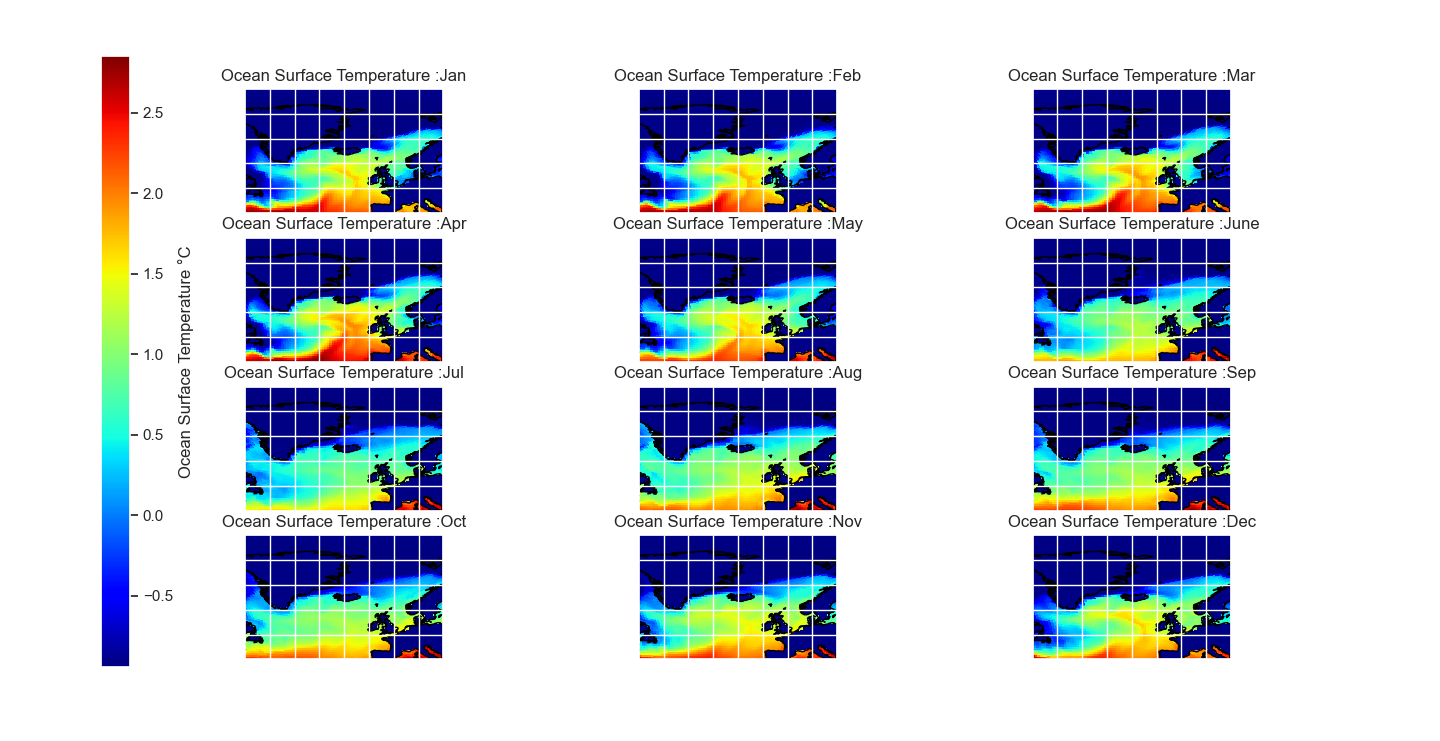
tos = (tos-tos.mean())/tos.std()And it seems wrong because when I plot my data and realized maps, I see anomalies but in an area always with the same temperature (or almost the same over the year) I saw an negative anomalie.
So I thing my line make anomalies over the area mean and no for each point (I want the annual mean for each point and then create anomalies plot).
I add maps to illustrate, near the Greenland it should be green, because zero anomalie (or almost).
Replies (5)
RE: Normalised dataset - Added by Karin Meier-Fleischer almost 4 years ago
Without further information about the data and the script I can not say if there is something wrong, but I guess you are already using Python.
clim_file = cdo.ymonmean(input='-selname,tos '+infile)
std_file  = cdo.ymonstd(input='-selname,tos '+infile)
anom_file = cdo.sub(input=infile+' '+clim_file)
anom_std  = cdo.div(input=anom_file+' '+std_file, returnXArray='tos')
RE: Normalised dataset - Added by Bérénice Ferrand almost 4 years ago
Yes, I am using Python.
I have netCDF file, and I use CDO to analyse my data.
To normalise I used this previous line, apply on the data treated by CDO, but it seems to no working. So I was wondering if I use an CDO line to normalise the data it may be works.
I explain : I have temperature data and I want to visualize them on maps. To compare different years I have to normalize them.
The code:
import netCDF4 as nc
import numpy as np
import cdo
import pandas as pd
import cartopy
import cartopy.crs as cars
import matplotlib.cm as cm
from netCDF4 import Dataset
from netCDF4 import num2date
import cartopy.feature as cfeature
import matplotlib as mpl
import matplotlib.pylab as plt
from cdo import Cdo
cdo = Cdo()
tos = "/Users/fb/Desktop/Stage/tos.nc"
ds = nc.Dataset(tos)
print(ds) #or print(ds.file_format)
infile = "/Users/fb/Desktop/Stage/tos.nc"
cdo.seldate('1870-01-01,1870-12-31', input=infile, output="tos_1870.nc")
cdo.sellonlatbox('-60,20,90,40', input="tos_1870.nc", output="tos_1870_2.nc")
cdo.ymonavg(input="tos_1870_2.nc", output="tos_1870_mean.nc")
month_name=["Jan","Feb","Mar","Apr","May","June","Jul","Aug","Sep","Oct","Nov","Dec"]
data = "/Users/fb/Desktop/Stage/tos_1870_mean.nc"
dset = Dataset(data)
fig = plt.figure(figsize=(24,24))
cmap = plt.cm.jet
for imonth in np.arange(1,13):
ax = fig.add_subplot(4,3,imonth, projection=ccrs.PlateCarree())
tos = dset.variables['tos'][imonth-1, :, :]
tos = (tos-tos.mean())/tos.std()
lon = dset.variables['longitude'][:]
lat = dset.variables['latitude'][:]
ax.set_extent([-60,20,90,40])
ax.coastlines()
plt.title('Ocean Surface Temperature :'+ month_name[imonth-1],fontsize=12)
ax.stock_img()
ax.gridlines(linewidth=1, color='black', alpha=0.5, linestyle='--')
a = ax.pcolormesh(lon, lat, tos, data=dset, cmap=cmap)
cax = plt.axes([0.07, 0.1, 0.02, 0.825])
plt.colorbar(a, cax, cmap=cmap, orientation='vertical', label='Ocean Surface Temperature °C', )
plt.savefig('fig_tos_1870.png')
plt.show()
RE: Normalised dataset - Added by Karin Meier-Fleischer almost 4 years ago
You are using the netCDF4 package and my example from above uses Xarray instead to read the netCDF data which allows to pass cdo results to a data array.
RE: Normalised dataset - Added by Bérénice Ferrand almost 4 years ago
Thanks for your answer but I don't understand how to visualise this.
RE: Normalised dataset - Added by Karin Meier-Fleischer almost 4 years ago
Sorry, but that doesn't really belong to CDO anymore. Have a look at the Matplotlib examples gallery. https://matplotlib.org/stable/gallery/index