Add linear regression line
Added by Bérénice Ferrand almost 4 years ago
Hi, I want to add linear regression line to my plot. I want to used :
cdo.regress(input, output)I plot : surface runoff = f(temperature). Do I have to regress surface runoff and then temperature and after do an plot with this new dataset ?
Thanks 
Replies (8)
RE: Add linear regression line - Added by Bérénice Ferrand almost 4 years ago
This is my last line of my code :
data = xr.open_dataset("./mrros_1850-2014_ymean.nc")
mrros = data.mrros.data
dataa = xr.open_dataset("./tos_1850-2014_ymean.nc")
tos = dataa.tos.data
plt.figure(figsize=(24, 12))
plt.title('Ocean surface temperature in function of the surface runoff for September to November from 1850 to 2014', size=20)
plt.xlabel('Surface runoff (kg.m-2.s-1)')
plt.ylabel('Ocean surface temperature($^\degree$C)')
plt.scatter(mrros, tos)
RE: Add linear regression line - Added by Bérénice Ferrand almost 4 years ago
Maybe I should create a new dataset with regress data and add this to my plot ?
I not sure of what is the best and the more correct way to do this.
RE: Add linear regression line - Added by Karin Meier-Fleischer almost 4 years ago
I would recommend to use Numpy's polyfit to generate the trend line for the scatter plot.
Short example with random numbers
import numpy as np
import matplotlib.pyplot as plt

x = np.random.uniform(1, 200,100)
y = np.random.uniform(50, 100,100)

m, b = np.polyfit(x, y, 1)

fig = plt.figure(figsize=(12,6))
ax = fig.add_subplot(111)

ax.scatter(x, y)
ax.plot(x, m*x + b)
RE: Add linear regression line - Added by Bérénice Ferrand almost 4 years ago
If I want to use my data, can I only do :
tos = np.array(tos)
mrros = np.array(mrros)
and after replace x and y by mrros and tos ?
I tried and I have :
TypeError: expected 1D vector for xRE: Add linear regression line - Added by Karin Meier-Fleischer almost 4 years ago
This is a Python error and not CDO, besides without the data files you use it is not really possible to help.
Does your short script run without the regression part?
RE: Add linear regression line - Added by Bérénice Ferrand almost 4 years ago
Yes my script run before the regression part.
This my data, I plot : tos = f(mrros), I tried to add the regression part but it doesn't work, maybe because of the size of my data (it is netCDF file).
I just want to add a linear regression line do this plot. I also tried with the tool 'linear regression" but impossible to install this package.
| mrros_1850-2014_ymean.nc (92.8 KB) mrros_1850-2014_ymean.nc | mrros_data | ||
| tos_1850-2014_ymean.nc (59.4 KB) tos_1850-2014_ymean.nc | tos_data |
RE: Add linear regression line - Added by Bérénice Ferrand almost 4 years ago
I understand that this does not concern cdo anymore so it has no place on this forum. Anyway, I thank you for your precious help so far !
RE: Add linear regression line - Added by Karin Meier-Fleischer almost 4 years ago
Well, as Dennis Shea likes to say: 'Have a look at your data!'.
The data.mmros and dataa.tos are multi-dimensional and you have to get rid of the one-size dimensions with the squeeze() method.
import matplotlib.pyplot as plt
import numpy as np
import xarray as xr
data = xr.open_dataset("/Users/k204045/Downloads/mrros_1850-2014_ymean.nc")
mrros = data.mrros.squeeze()
dataa = xr.open_dataset("/Users/k204045/Downloads/tos_1850-2014_ymean.nc")
tos = dataa.tos.squeeze()
#-- compute slope and intercept
m, b = np.polyfit(mrros, tos, 1)
#-- create the plot
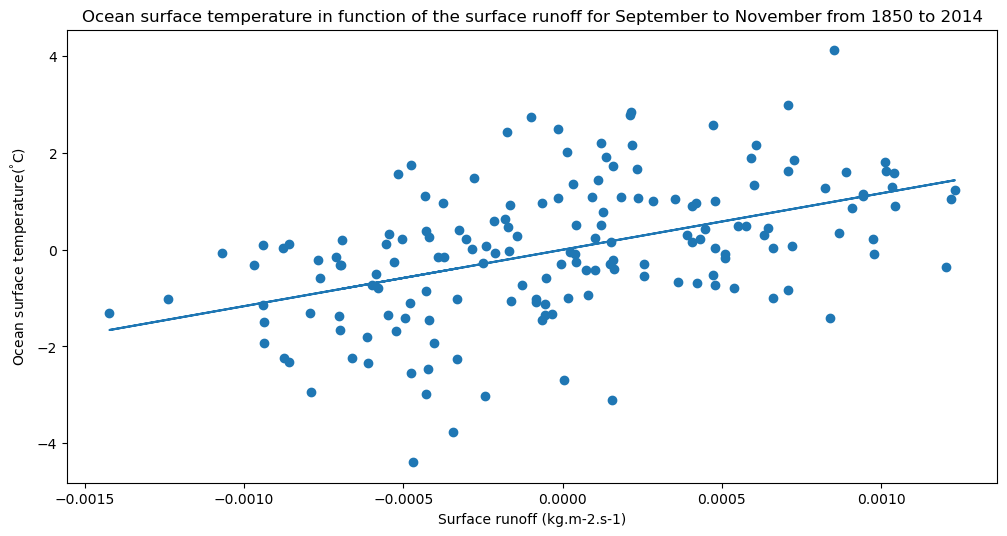
fig, ax = plt.subplots(figsize=(12,6))
plt.title('Ocean surface temperature in function of the surface runoff for September to November from 1850 to 2014', size=12)
plt.xlabel('Surface runoff (kg.m-2.s-1)')
plt.ylabel('Ocean surface temperature($^\degree$C)')
plt.scatter(mrros, tos)
ax.plot(mrros, m*mrros + b)
plt.savefig('plot_scatter_plus_trend.png', bbox_inches='tight', facecolor='white', dpi=200)