Yearly statistics issue
Added by jay qiu almost 11 years ago
Hi,
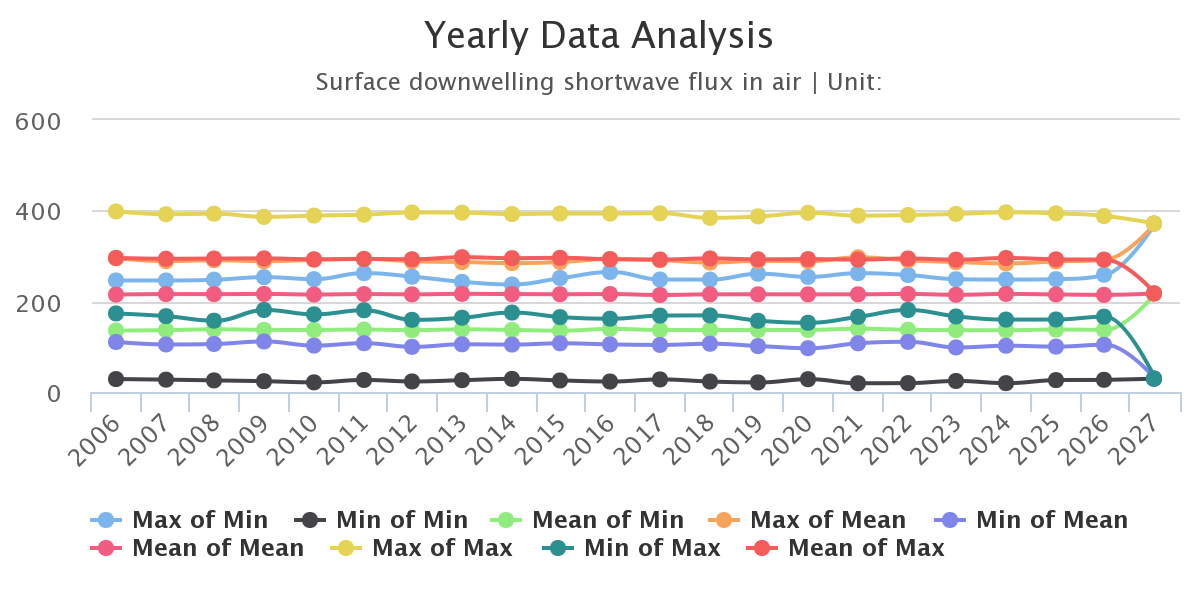
I got same value in the last year whatever i used yearmin, yearmax or yearmean to analysis netCDF data.
I have no idea is this a bug or not ?
The output data shows as below:
Yearly Analysis
Max:
-1 : Date Time Level Gridsize Miss : Minimum Mean Maximum : Parameter ID
1 : 2006-07-01 06:00:00 0 1258 0 : 173.29 295.71 398.36 : -1
2 : 2007-07-01 06:00:00 0 1258 0 : 167.29 293.92 392.08 : -1
3 : 2008-07-01 06:00:00 0 1258 0 : 157.25 294.35 393.30 : -1
4 : 2009-07-01 06:00:00 0 1258 0 : 180.91 294.73 386.27 : -1
5 : 2010-07-01 06:00:00 0 1258 0 : 171.26 292.69 389.10 : -1
6 : 2011-07-01 06:00:00 0 1258 0 : 180.29 293.33 391.11 : -1
7 : 2012-07-01 06:00:00 0 1258 0 : 159.18 292.85 396.04 : -1
8 : 2013-07-01 06:00:00 0 1258 0 : 163.87 297.30 395.58 : -1
9 : 2014-07-01 06:00:00 0 1258 0 : 175.25 295.20 392.61 : -1
10 : 2015-07-01 06:00:00 0 1258 0 : 165.14 295.93 393.59 : -1
11 : 2016-07-01 06:00:00 0 1258 0 : 161.69 292.75 393.60 : -1
12 : 2017-07-01 06:00:00 0 1258 0 : 168.48 292.17 394.19 : -1
13 : 2018-07-01 06:00:00 0 1258 0 : 168.91 294.63 384.14 : -1
14 : 2019-07-01 06:00:00 0 1258 0 : 157.15 292.62 387.33 : -1
15 : 2020-07-01 06:00:00 0 1258 0 : 152.78 293.11 395.17 : -1
16 : 2021-07-01 06:00:00 0 1258 0 : 165.81 291.99 388.97 : -1
17 : 2022-07-01 06:00:00 0 1258 0 : 180.87 294.48 390.33 : -1
18 : 2023-07-01 06:00:00 0 1258 0 : 166.54 292.00 392.85 : -1
19 : 2024-07-01 06:00:00 0 1258 0 : 159.75 295.52 396.27 : -1
20 : 2025-07-01 06:00:00 0 1258 0 : 159.93 292.65 394.02 : -1
21 : 2026-07-01 06:00:00 0 1258 0 : 166.12 291.95 388.14 : -1
22 : 2027-01-16 12:00:00 0 1258 0 : 29.469 217.32 371.58 : -1
Mean:
-1 : Date Time Level Gridsize Miss : Minimum Mean Maximum : Parameter ID
1 : 2006-07-01 06:00:00 0 1258 0 : 110.30 214.89 294.97 : -1
2 : 2007-07-01 06:00:00 0 1258 0 : 104.85 215.99 288.67 : -1
3 : 2008-07-01 06:00:00 0 1258 0 : 105.98 215.86 290.69 : -1
4 : 2009-07-01 06:00:00 0 1258 0 : 111.44 216.25 288.49 : -1
5 : 2010-07-01 06:00:00 0 1258 0 : 102.38 214.98 291.64 : -1
6 : 2011-07-01 06:00:00 0 1258 0 : 107.62 216.00 293.76 : -1
7 : 2012-07-01 06:00:00 0 1258 0 : 99.589 215.35 288.27 : -1
8 : 2013-07-01 06:00:00 0 1258 0 : 105.26 216.46 286.62 : -1
9 : 2014-07-01 06:00:00 0 1258 0 : 104.55 215.98 284.32 : -1
10 : 2015-07-01 06:00:00 0 1258 0 : 107.40 215.63 286.85 : -1
11 : 2016-07-01 06:00:00 0 1258 0 : 104.97 216.02 293.54 : -1
12 : 2017-07-01 06:00:00 0 1258 0 : 103.83 213.95 290.79 : -1
13 : 2018-07-01 06:00:00 0 1258 0 : 106.45 215.39 285.58 : -1
14 : 2019-07-01 06:00:00 0 1258 0 : 101.29 215.49 289.24 : -1
15 : 2020-07-01 06:00:00 0 1258 0 : 96.631 215.36 288.44 : -1
16 : 2021-07-01 06:00:00 0 1258 0 : 107.46 215.43 297.05 : -1
17 : 2022-07-01 06:00:00 0 1258 0 : 110.65 216.20 290.50 : -1
18 : 2023-07-01 06:00:00 0 1258 0 : 98.280 214.41 286.45 : -1
19 : 2024-07-01 06:00:00 0 1258 0 : 101.99 216.34 283.70 : -1
20 : 2025-07-01 06:00:00 0 1258 0 : 100.12 215.14 287.98 : -1
21 : 2026-07-01 06:00:00 0 1258 0 : 104.26 214.28 291.73 : -1
22 : 2027-01-16 12:00:00 0 1258 0 : 29.469 217.32 371.58 : -1
Min:
-1 : Date Time Level Gridsize Miss : Minimum Mean Maximum : Parameter ID
1 : 2006-07-01 06:00:00 0 1258 0 : 28.506 135.44 246.06 : -1
2 : 2007-07-01 06:00:00 0 1258 0 : 27.250 136.42 246.00 : -1
3 : 2008-07-01 06:00:00 0 1258 0 : 25.542 138.23 247.69 : -1
4 : 2009-07-01 06:00:00 0 1258 0 : 23.808 137.11 253.34 : -1
5 : 2010-07-01 06:00:00 0 1258 0 : 21.251 136.89 248.90 : -1
6 : 2011-07-01 06:00:00 0 1258 0 : 26.514 137.75 262.24 : -1
7 : 2012-07-01 06:00:00 0 1258 0 : 23.256 136.44 254.24 : -1
8 : 2013-07-01 06:00:00 0 1258 0 : 26.102 138.15 242.94 : -1
9 : 2014-07-01 06:00:00 0 1258 0 : 28.907 136.84 237.25 : -1
10 : 2015-07-01 06:00:00 0 1258 0 : 25.405 135.29 251.44 : -1
11 : 2016-07-01 06:00:00 0 1258 0 : 23.099 139.09 264.68 : -1
12 : 2017-07-01 06:00:00 0 1258 0 : 27.698 136.80 248.11 : -1
13 : 2018-07-01 06:00:00 0 1258 0 : 23.062 136.70 247.97 : -1
14 : 2019-07-01 06:00:00 0 1258 0 : 21.152 136.81 260.86 : -1
15 : 2020-07-01 06:00:00 0 1258 0 : 28.211 137.04 253.94 : -1
16 : 2021-07-01 06:00:00 0 1258 0 : 19.304 139.55 262.10 : -1
17 : 2022-07-01 06:00:00 0 1258 0 : 19.564 137.28 258.00 : -1
18 : 2023-07-01 06:00:00 0 1258 0 : 24.275 136.43 248.76 : -1
19 : 2024-07-01 06:00:00 0 1258 0 : 19.527 136.35 247.98 : -1
20 : 2025-07-01 06:00:00 0 1258 0 : 26.198 137.71 248.89 : -1
21 : 2026-07-01 06:00:00 0 1258 0 : 26.880 137.11 258.68 : -1
22 : 2027-01-16 12:00:00 0 1258 0 : 29.469 217.32 371.58 : -1
| chart.png (134 KB) chart.png | all | ||
| chart(1).png (88.1 KB) chart(1).png | min | ||
| chart(2).png (87.5 KB) chart(2).png | mean | ||
| chart(3).png (89.4 KB) chart(3).png | max |
.png)
.png)
.png)
Replies (2)
RE: Yearly statistics issue - Added by Uwe Schulzweida almost 11 years ago
Thats because the last year contains only one time step, the monthly mean of January!?
RE: Yearly statistics issue - Added by jay qiu almost 11 years ago
Dear Uwe,
yes, seems like that, sorry for asking a stupid question,
I should check it carefully before posting.
Thanks for your help.
Jay