interpolate xyz data
Added by Francesco Maicu almost 5 years ago
Dear CDO Supporters,
I have a bathymetry file (text) similar to the attached one.
Data are tab separated and look like lat lon depth.
Is there a way to interpolate to a netcdf grid?
I mean something similat to remapbil or remapnn?
Thanks a lot!
Francesco
Replies (5)
RE: interpolate xyz data - Added by Karin Meier-Fleischer almost 5 years ago
Hi Francesco,
you have to split the ASCII data to generate a grid descriptor file and an ASCII file containing the bathymetry data.
The best to do this is to use a shell script like ksh script below.
It does
- read lat, lon, and data
- generate the grid description file for the unstructured grid
- set time dimension, and write to netCDF file bathymetry.nc
If you want to remap the unstructured data to a lonlat grid you can use the remapnn operator using a target grid. The target grid in this example is created by the topo operator (global grid 0.1x0.1 degrees) where we extract the region of your data before the remapping.
#!/bin/ksh

input="test.xyz"

varname="bathy"                         #-- set variable name

time="2000-01-01,00:12:00,12hour"       #-- init time axis

#-- read lat, lon and data

lat=$(cat $input | awk '{$2=$2};1' | cut -d ' ' -f 1)
lon=$(cat $input | awk '{$2=$2};1' | cut -d ' ' -f 2)

cat $input | awk '{$2=$2};1' | cut -d ' ' -f 3 > bathy.txt

nlines=$(cat $input | wc -l)

#-- generate the grid description file for $input

cat << EOF > gridfile.txt
gridtype  = unstructured
gridsize  = ${nlines}
xname     = lon
xlongname = longitude
xunits    = degrees_east
yname     = lat
ylongname = latitude
yunits    = degrees_north
xsize     = ${nlines}
ysize     = ${nlines}
xvals     = ${lon}
yvals     = ${lat}
EOF

#-- convert ASCII data to netCDF

cdo -r -f nc -settaxis,$time -setname,${varname} -input,gridfile.txt \
              bathymetry.nc < bathy.txt

#-- remap to 0.1 degrees grid

cdo -f nc -sellonlatbox,40.2,40.8,28.7,30.0 -topo,global_0.1 topo_0.1.nc

cdo -remapnn,topo_0.1.nc bathymetry.nc outfile.nc
-Karin
RE: interpolate xyz data - Added by Francesco Maicu almost 5 years ago
Dear Karin
thank you for your useful reply.
I understand I can skip
cdo -f nc -sellonlatbox,40.2,40.8,28.7,30.0 -topo,global_0.1 topo_0.1.nc
because I already have the target grid.
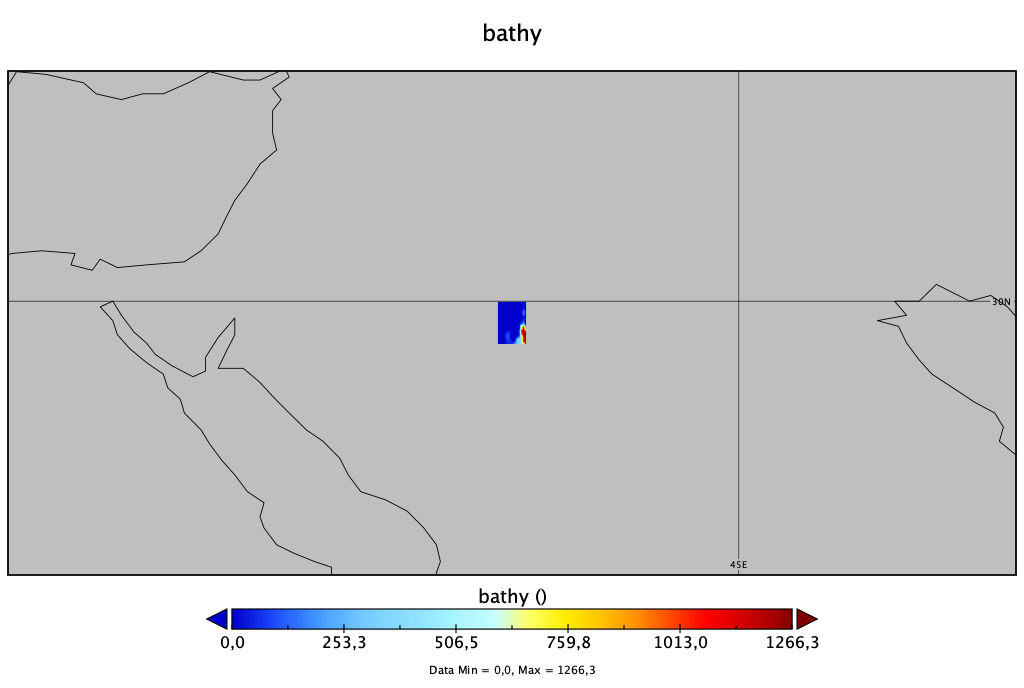
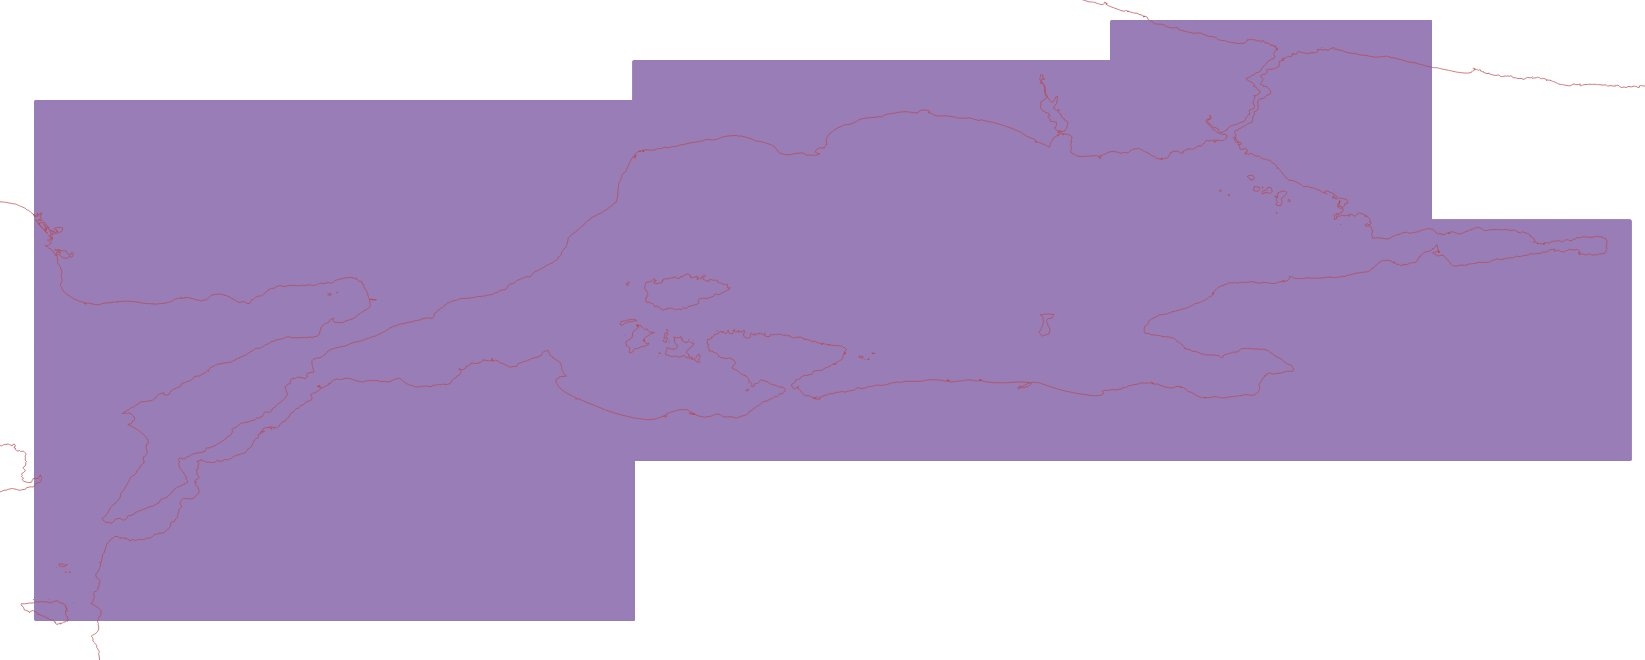
The baathymetric points are collected in an unstructured file like the one plotted on the map I attached.
In order to avoid interpolating zeros, I set to miss with cdo -setrtomiss,-1,5 ......
The nn remapping gives a strage result, that I attached. The extent of the remapped area is ok, but as you can see I do not understand why it looks like an extrapolation down to left bottom corner.
This is the ncdump of the unstructured bathymetry file:
netcdf bathymetry_missval {
dimensions:
time = UNLIMITED ; // (1 currently)
ncells = 11392304 ;
variables:
double time(time) ;
time:standard_name = "time" ;
time:units = "hours since 2000-1-1 00:12:00" ;
time:calendar = "proleptic_gregorian" ;
time:axis = "T" ;
double lon(ncells) ;
lon:standard_name = "longitude" ;
lon:long_name = "longitude" ;
lon:units = "degrees_east" ;
double lat(ncells) ;
lat:standard_name = "latitude" ;
lat:long_name = "latitude" ;
lat:units = "degrees_north" ;
float bathymetry(time, ncells) ;
bathymetry:CDI_grid_type = "unstructured" ;
bathymetry:coordinates = "lat lon" ;
bathymetry:_FillValue = -9.e+33f ;
bathymetry:missing_value = -9.e+33f ;// global attributes:
:CDI = "Climate Data Interface version 1.9.4 (http://mpimet.mpg.de/cdi)" ;
:Conventions = "CF-1.6" ;
:history = "Wed Jul 21 13:42:47 2021: cdo -setrtomiss,-1,5 bathymetry.nc bathymetry_missval.nc\n",
"Wed Jul 21 13:25:52 2021: cdo -r -f nc -settaxis,2000-01-01,00:12:00,12hour -setname,bathymetry -input,gridfile.txt bathymetry.nc" ;
:CDO = "Climate Data Operators version 1.9.4 (http://mpimet.mpg.de/cdo)" ;
Any idea?
| bathymetric_points.png (94.5 KB) bathymetric_points.png | |||
| out.nc (4.76 MB) out.nc |
RE: interpolate xyz data - Added by Karin Meier-Fleischer almost 5 years ago
What are the target grid file coordinates? I guess there is something wrong with the target grid or the coordinates in the CSV input file are not correct (are they (lat,lon,value)?).
Your uploaded out.nc shows:
cdo sinfon out.nc
   File format : NetCDF2
    -1 : Institut Source   T Steptype Levels Num    Points Num Dtype : Parameter name
     1 : unknown  unknown  v instant       1   1   1244407   1  F32  : bathymetry
   Grid coordinates :
     1 : lonlat                   : points=1244407 (1657x751)
                              lon : -24 to 45.00005 by 0.0416667 degrees_east
                              lat : 25.0625 to 56.31253 by 0.0416667 degrees_north
   Vertical coordinates :
     1 : surface                  : levels=1
   Time coordinate :  1 step
     RefTime =  2000-01-01 00:12:00  Units = hours  Calendar = proleptic_gregorian
  YYYY-MM-DD hh:mm:ss  YYYY-MM-DD hh:mm:ss  YYYY-MM-DD hh:mm:ss  YYYY-MM-DD hh:mm:ss
  2000-01-01 00:12:00
The bounds of the coordinates of the given test.xyz file are (it is a very small area):
Lat min:  28.7
Lat max:  30.0

Lon min:  40.2
Lon max:  40.8
The center is Dumat Al-Jandal Saudi-Arabien
| bathy_in_outfile_2.png (33.3 KB) bathy_in_outfile_2.png |
RE: interpolate xyz data - Added by Francesco Maicu almost 5 years ago
Karin Meier-Fleischer wrote in RE: interpolate xyz data:
What are the target grid file coordinates? I guess there is something wrong with the target grid or the coordinates in the CSV input file are not correct (are they (lat,lon,value)?).
Your uploaded out.nc shows:
[...]
The bounds of the coordinates of the given test.xyz file are (it is a very small area):
[...]The center is Dumat Al-Jandal Saudi-Arabien

Hi Karin,
The target grid file coordinates are corrected as shown by the cdo sinfo.
I already used that nc file as target grid descriptor in another successfull cdo remapping.
The xyz file is corrected (lon,lat,depth so I changed lon with lat in your script) is on the Marmara Sea as shown in the Figure of the bathymetric points.
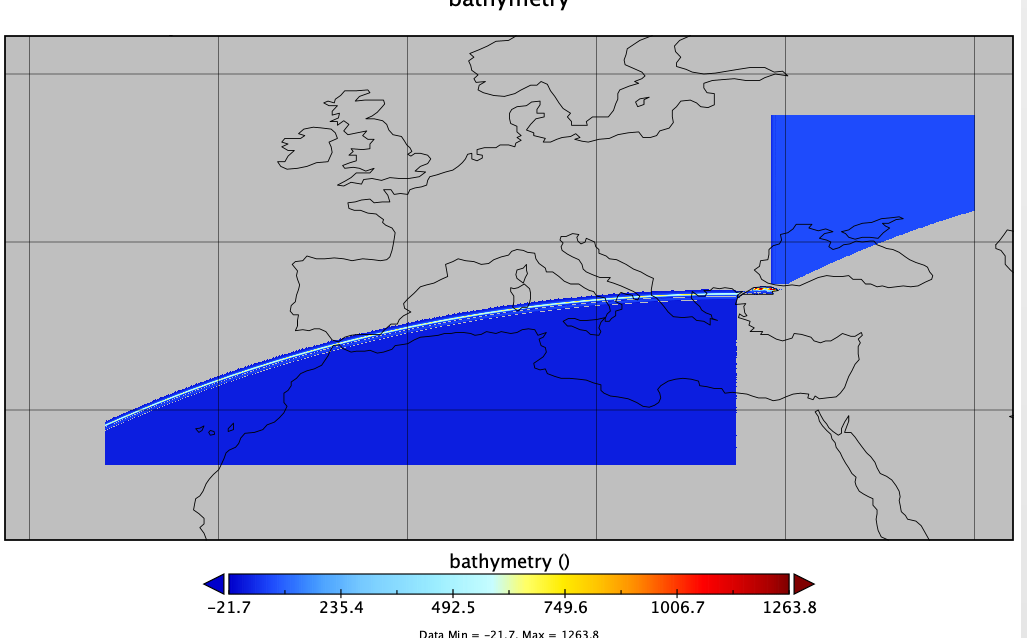
The extension of the file remapped is ok as you can see in bathy1.png, considering that in the grey area no interpolation occurs.
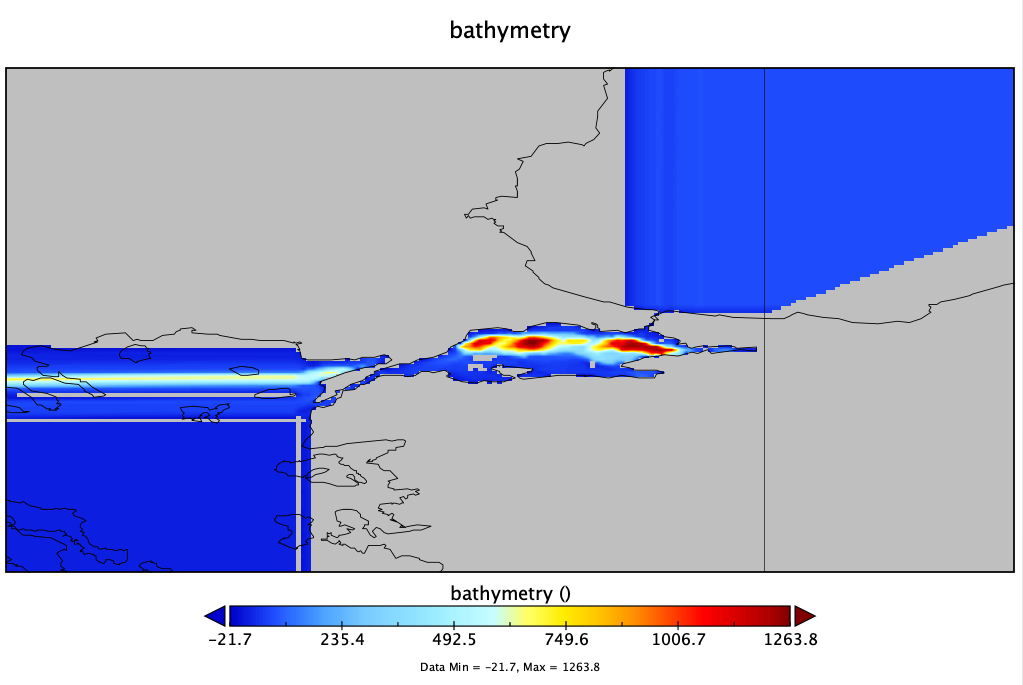
Again the remapping seems to be ok in the interested area as you can see in bathy_detailed.png
The images are taken from the out.nc that I attached.
Thanks
| bathy1_detail.png (89.7 KB) bathy1_detail.png | |||
| bathy1.png (88.8 KB) bathy1.png |
RE: interpolate xyz data - Added by Karin Meier-Fleischer almost 5 years ago
Sorry, but IMO CDO can't do the job. But NCL can do it. The following script reads the test.xyz data and uses ESMF to regrid to the given out.nc target grid. It also writes the regridded data to a new netCDF file and creates a panel plot which shows the result of the original data from test.xyz and the regridded data.
load "$NCARG_ROOT/lib/ncarg/nclscripts/esmf/ESMF_regridding.ncl"

fname = "test.xyz"

lines = asciiread(fname, -1, "string")

lon = tofloat(str_get_field(str_squeeze(lines), 1," "))
lat = tofloat(str_get_field(str_squeeze(lines), 2," "))
var = tofloat(str_get_field(str_squeeze(lines), 3," "))

var@_FillValue = 1e33
var = where(var .gt. 0, var, var@_FillValue)

nvalues = dimsizes(var)

print("-----------------------------")
print(""+nvalues)
print(""+dimsizes(lon))
print(""+dimsizes(lat))
print("-----------------------------")
print("var min/max: "+min(var)+" "+max(var))
print("-----------------------------")

;-- destination grid file

destf = addfile("out.nc", "r")
dest_lon = destf->lon
dest_lat = destf->lat

minlat = min(lat)
maxlat = max(lat)
minlon = min(lon)
maxlon = max(lon)

;-- options for regridding

method = "bilinear"; "neareststod"

opt = True
opt@SrcGridLat     = lat
opt@SrcGridLon     = lon
opt@SrcMask2D      = where(ismissing(var), 0, 1)
opt@SrcRegional    = True

opt@DstGridLat     = dest_lat
opt@DstGridLon     = dest_lon
opt@DstRegional    = True

opt@SkipDstGrid    = False
opt@SkipWgtGen     = False

opt@InterpMethod   = method

opt@ForceOverwrite = True
opt@Debug          = True

var_regrid = ESMF_regrid(var, opt)

print("---")
printVarSummary(var_regrid)

;-- write remapped data to new file
system("rm -rf test_remapped.nc")
fout = addfile("test_remapped.nc", "c")
fout->bathy = var_regrid
delete(fout)

print("---")
print("--> start plotting")
print("---")

;-- plotting

wks = gsn_open_wks("png","plot_csv_"+method)

res = True
res@gsnDraw         = False
res@gsnFrame        = False
res@gsnAddCyclic    = False

res@cnFillMode      = "RasterFill"
res@cnFillOn        = True
res@cnLinesOn       = False
res@cnLineLabelsOn  = False

mnmxint = nice_mnmxintvl( min(var), max(var), 15, False)

res@cnLevelSelectionMode = "ManualLevels"
res@cnMinLevelValF  = mnmxint(0)
res@cnMaxLevelValF  = mnmxint(1)
res@cnLevelSpacingF = mnmxint(2)

res@lbLabelBarOn    = False

res@mpFillOn        = False
res@mpMinLatF       = floor(minlat)-0.5
res@mpMaxLatF       =  ceil(maxlat)+2.0
res@mpMinLonF       = floor(minlon)-2.0
res@mpMaxLonF       =  ceil(maxlon)+0.5
res@mpDataBaseVersion = "HighRes"

res@tmXTOn          = False
res@tmYROn          = False

res@tiMainFontHeightF = 0.02

;-- plotting original data

ores = res
ores@sfXArray       = lon
ores@sfYArray       = lat

;-- create plots

ores@tiMainString = "CSV original data"
plot1 = gsn_csm_contour_map(wks, var, ores)

res@tiMainString  = "Regridded to target grid out.nc using '"+method+"'"
plot2 = gsn_csm_contour_map(wks, var_regrid, res)

getvalues plot1
    "vpWidthF"  :  vpw
    "vpHeightF" :  vph
end getvalues

;-- create panel

pres = True
pres@gsnPanelLabelBar   = True
pres@pmLabelBarWidthF   = 0.7
pres@gsnMaximize        = True
pres@lbBoxLinesOn       = False
pres@lbLabelFontHeightF = 0.01

gsn_panel(wks, (/plot1, plot2/), (/2,1/), pres)
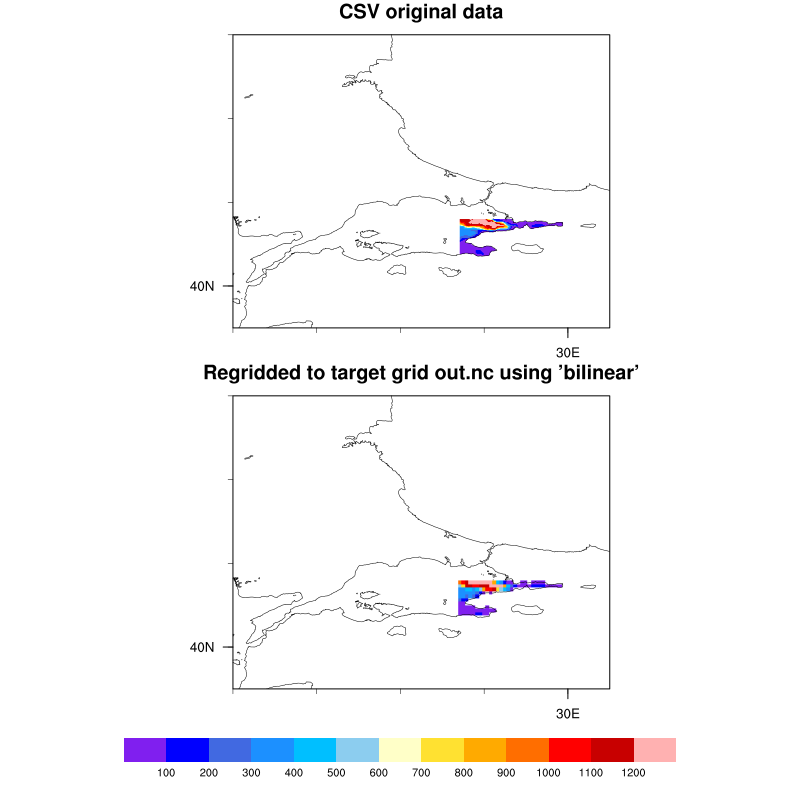
| plot_csv_bilinear.png (60.1 KB) plot_csv_bilinear.png |