unwanted output from cdo remapbil
Added by Fredrik Boberg about 5 years ago
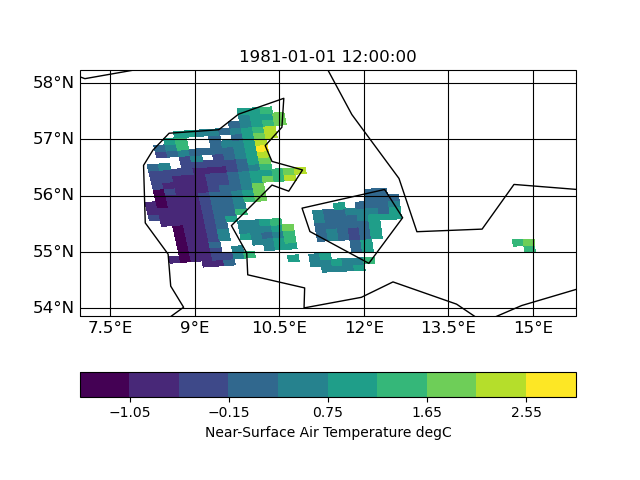
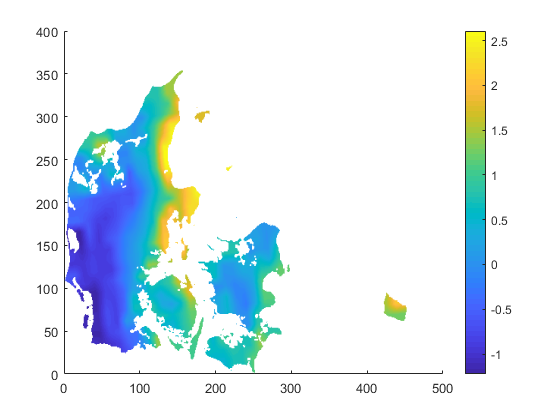
I am trying to regrid a coarse dataset (12x12 km) to a finer (1x1 km) for Denmark with the command
cdo remapbil,target.nc infile.nc outfile.nc
I have attached all three netCDF files. The file outfile.nc seems to be missing a lot of grid cells. I suspect that missing values in the infile.nc are not treated as missing values but are somehow included in the remapping routine.
ncdump -h target.nc gives:
dimensions:
x = 452 ;
y = 354 ;
variables:
double lon(y, x) ;
lon:standard_name = "longitude" ;
lon:long_name = "longitude" ;
lon:units = "degrees_east" ;
lon:_CoordinateAxisType = "Lon" ;
double lat(y, x) ;
lat:standard_name = "latitude" ;
lat:long_name = "latitude" ;
lat:units = "degrees_north" ;
lat:_CoordinateAxisType = "Lat" ;
double lsm(y, x) ;
lsm:standard_name = "lsm" ;
lsm:units = "%" ;
lsm:coordinates = "lon lat" ;
lsm:missing_value = -9.e+33 ;
lsm:_FillValue = -9.e+33 ;
ncdump -h infile.nc gives
dimensions:
x = 39 ;
y = 34 ;
time = UNLIMITED ; // (1 currently)
variables:
double lon(y, x) ;
lon:standard_name = "longitude" ;
lon:long_name = "longitude" ;
lon:units = "degrees_east" ;
lon:_CoordinateAxisType = "Lon" ;
double lat(y, x) ;
lat:standard_name = "latitude" ;
lat:long_name = "latitude" ;
lat:units = "degrees_north" ;
lat:_CoordinateAxisType = "Lat" ;
double time(time) ;
time:standard_name = "time" ;
time:units = "days since 1951-01-01 12:00:00" ;
time:calendar = "365_day" ;
float tas(time, y, x) ;
tas:standard_name = "air_temperature" ;
tas:long_name = "Near-Surface Air Temperature" ;
tas:units = "degC" ;
tas:coordinates = "lon lat" ;
tas:_FillValue = 1.e+20f ;
tas:missing_value = 1.e+20f ;
Any help in solving the problem is greatly appreciated. I use cdo 1.6.6.
Best regards,
Fredrik Boberg
| outfile.nc (3.05 MB) outfile.nc | |||
| infile.nc (28 KB) infile.nc | |||
| target.nc (3.66 MB) target.nc |
Replies (10)
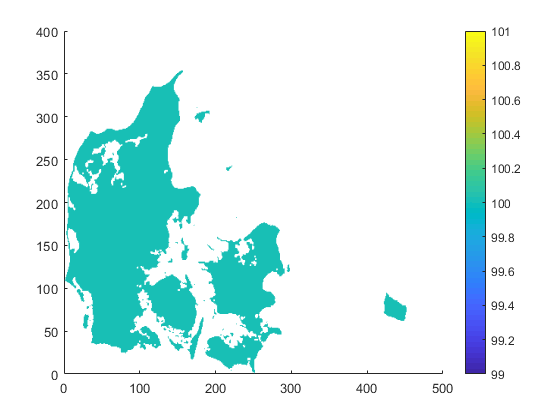
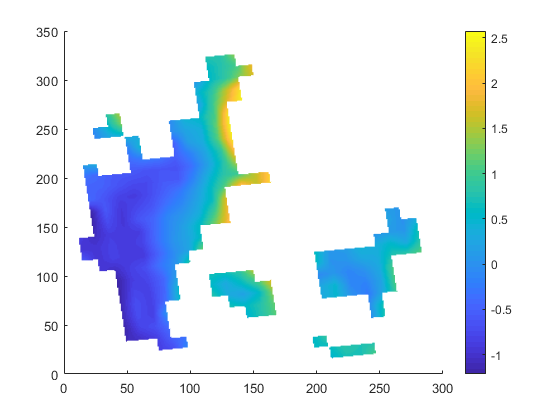
RE: unwanted output from cdo remapbil - Added by Fredrik Boberg about 5 years ago
| target.nc | infile.nc | outfile.nc |
 |
 |
 |
| target.png (23.4 KB) target.png | |||
| infile.png (11.4 KB) infile.png | |||
| outfile.png (41.1 KB) outfile.png |
RE: unwanted output from cdo remapbil - Added by Ralf Mueller about 5 years ago
hi!
thx for the uploads. I had look into the input file and (to me) it look like this (using CDO 1.9.10):
| target | infile | outfile |
 |
 |
 |
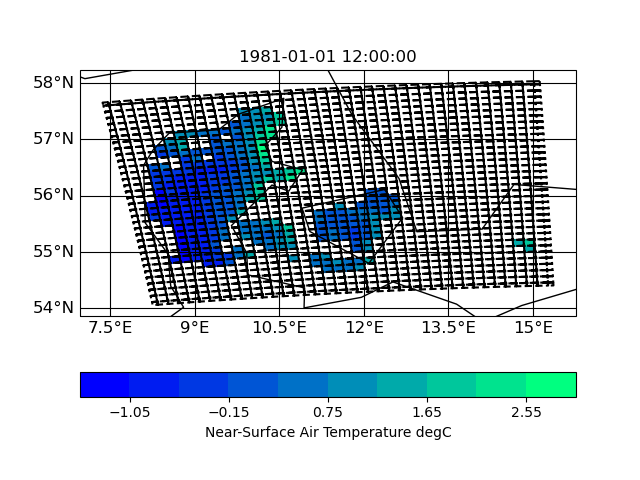
the slightly slanted representation in the output seems to be caused by the curvilinear grid of the input. but since it is a scaling from 12km to 1km I am surprised that the field in 1km looks worse compared to 12km. certain data regions (like the are in the south-east part of the input) are lost in the high-red output.
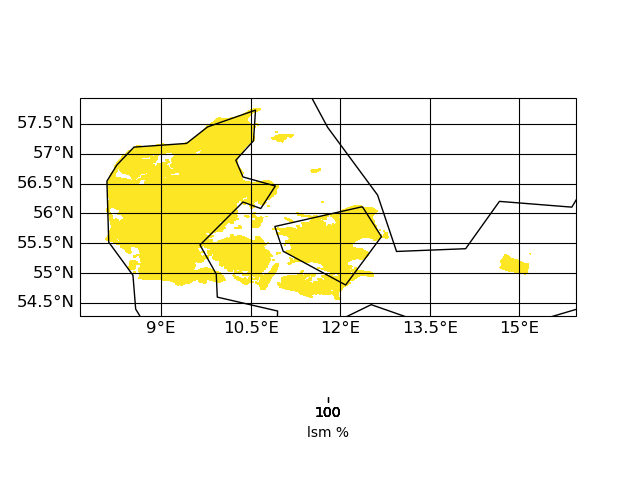
Here are some plots of the grids
| input grid corners | target grid corners |
 |
 |
IMO the target grid covers the whole input grid - hence nothing of the input should get lost during interpolation. I have to look into this in more detail ...
| Figure_infile.png (40.8 KB) Figure_infile.png | |||
| Figure_outfile.png (40.6 KB) Figure_outfile.png | |||
| Figure_target.png (32.3 KB) Figure_target.png | |||
| Bild15.jpg (41.5 KB) Bild15.jpg | |||
| Figure_target_corners.png (18.8 KB) Figure_target_corners.png | |||
| Figure_infile_corners.png (138 KB) Figure_infile_corners.png |
RE: unwanted output from cdo remapbil - Added by Ralf Mueller about 5 years ago
I now tested other interpolation methods: nearest neighbor, distance weighted and bi-qubic
| distance | neighbor | bi-qubic |
 |
 |
 |
So I think the missing data is related to a search-problem in remapbil/bic with your input/target grid. I hope, Uwe can say more about this.
| Bild15.jpg (41.5 KB) Bild15.jpg | |||
| Figure_bic.png (40.7 KB) Figure_bic.png | |||
| Figure_nn.png (41.3 KB) Figure_nn.png | |||
| Figure_dis.png (44.3 KB) Figure_dis.png |
RE: unwanted output from cdo remapbil - Added by Brendan DeTracey about 5 years ago
Looks normal to me. Bilinear requires four surrounding points. You could try some other remapping options such as remapnn or remapdis. In the end though, you are trying to upsample, which is never going to be perfect. I suggest you remask against your target grid for safety. e.g.:
cdo -O ifthen target.nc -remapdis,target.nc,2 infile.nc outfile_remapdis_2.nc
cdo -O ifthen target.nc -remapdis,target.nc,3 infile.nc outfile_remapdis_3.nc
cdo -O ifthen target.nc -remapdis,target.nc,4 infile.nc outfile_remapdis_4.nc
Edit: got ninja'd by ralf!
Doing a difference between these shows a lot of artefacts. This is why statistical upscaling is a thing.
If your infile and target included grid corners I think remapcon would give better results. You are also trying to extrapolate, which does not end well.
Edit2: A little smoothing before masking makes things pretty:
cdo -O ifthen target.nc -smooth,radius=6km,maxpoints=36 -remapdis,target.nc,3 infile.nc outfile_remapdis_3_smooth.nc
Pretty, but not very rigourous. It really depends on your application. Statistical upscaling would be the "proper" approach, but would involve a lot more work.
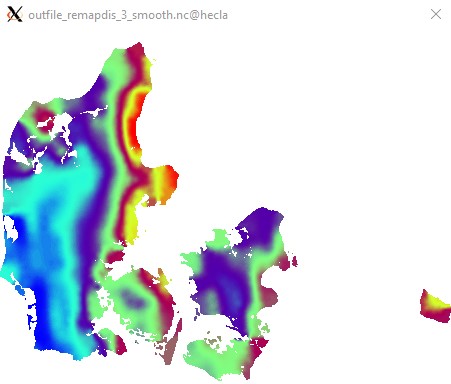

Edit3: Apologies for not using a CVD colormap. I do not think ncview has one...
RE: unwanted output from cdo remapbil - Added by Ralf Mueller about 5 years ago
Brendan DeTracey wrote in RE: unwanted output from cdo remapbil:
Looks normal to me. Bilinear requires four surrounding points. You could try some other remapping options such as
remapnnorremapdis. In the end though, you are trying to upsample, which is never going to be perfect. I suggest you remask against your target grid for safety. e.g.:[...]
cool - I was not aware of the second parameter of remapdis. I thought that a sampling from 12km to 1km should at least be able to keep the 3 gridboxes at the very eastern point in some way. Do you thing it is expectable that those simply vanish?
Edit: got ninja'd by ralf!
Tshakka!
Doing a difference between these shows a lot of artefacts. This is why statistical upscaling is a thing.
do you a good reference on this topic?
If your infile and target included grid corners I think
remapconwould give better results. You are also trying to extrapolate, which does not end well.
agreed: corners would help a lot here
Edit2: A little smoothing before masking makes things pretty:[...]
Pretty, but not very rigourous. It really depends on your application. Statistical upscaling would be the "proper" approach, but would involve a lot more work.Edit3: Apologies for not using a CVD colormap. I do not think ncview has one...


I switched over to psy-view: https://pypi.org/project/psy-view - Maybe it works under cygwin, too
cheers!
RE: unwanted output from cdo remapbil - Added by Brendan DeTracey about 5 years ago
Ralf Mueller wrote in RE: unwanted output from cdo remapbil:
cool - I was not aware of the second parameter of
remapdis. I thought that a sampling from 12km to 1km should at least be able to keep the 3 gridboxes at the very eastern point in some way. Do you thing it is expectable that those simply vanish?
I did not know about it either. Helping others helps me to occasionally to RTFM myself. :)
Without looking at the cdo source it is hard to say, but linear interpolation generally fails for points not fully within/on a grid cell(outside convex hull of valid cells), and this is a desired behavior. I tried REMAP_EXTRAPOLATE=ON, but it made no difference in this example.
Now that I think of it, another (better?) solution could be to setmisstonn on the original grid and then remapnn and mask.
cdo -O ifthen target.nc -remapnn,target.nc -setmisstonn infile.nc outfile_remapnn_setmisstonn.nc
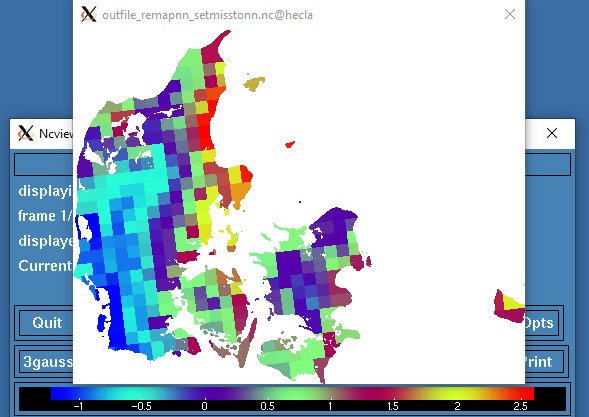
This is not the prettiest approach, but at least the existing values have not been distorted by
remapdis and smooth. Uwe might have a better suggestion.
It is best to just google "Statistical Downscaling". First results should be related to downscaling climate model results. R and python both have packages for it, but I have never used them. It is yet another thing I know exists, but know almost nothing about. It exists therefore I am.
I did not know about psy-view. I will have to check it out. Thanks!
RE: unwanted output from cdo remapbil - Added by Fredrik Boberg about 5 years ago
Dear CDO experts,
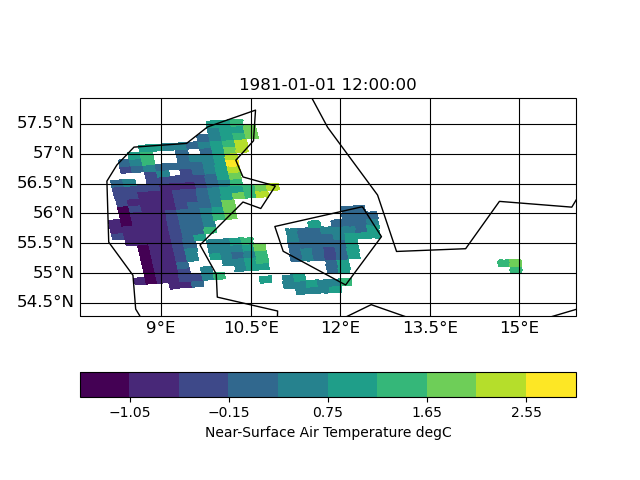
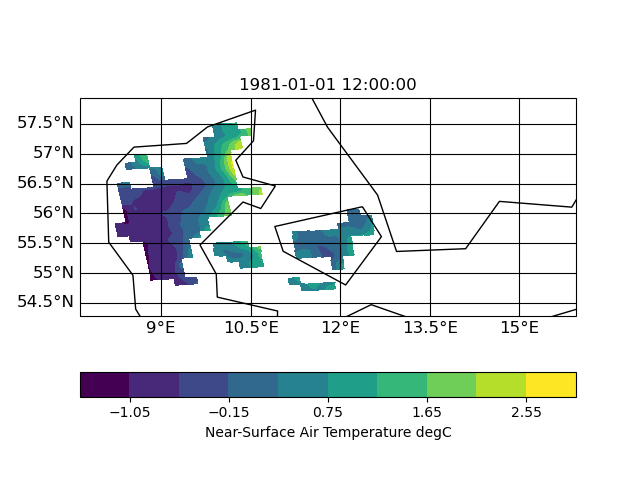
I just want to thank you for your collected effort in helping me. As you can tell, I am a beginner when it comes to CDO. I am fully aware of the risks with resampling data from 12 to 1 km using "simple" regridding methods and extrapolating to islands etc that are located far from any gridcells on the input grid, but the task I have is to do just this.
The solution I went with is (or: I will probably go with)
cdo -O ifthen target.nc -remapbil,target.nc -setmisstonn infile.nc outfile_remapnn_setmisstonn.nc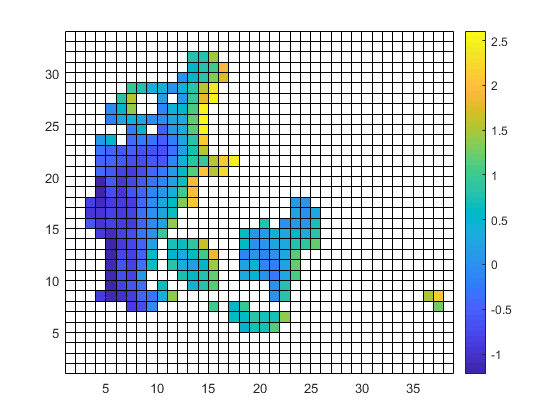
Once again: thanks to you all!
Best regards,
Fredrik
| infile2.png (11.4 KB) infile2.png | |||
| outfile2.png (54.6 KB) outfile2.png |
RE: unwanted output from cdo remapbil - Added by Ralf Mueller about 5 years ago
hi Fredrik!
u r welcome. I would like to know, how you did then plot on the left side. Is is matplotlib-based?
cheers
ralf
RE: unwanted output from cdo remapbil - Added by Fredrik Boberg about 5 years ago
They are done in Matlab, which I have worked with during the past 25 years. The left one with pcolor and the right one with surface(var,'LineStyle',none');
Cheers,
Fredrik
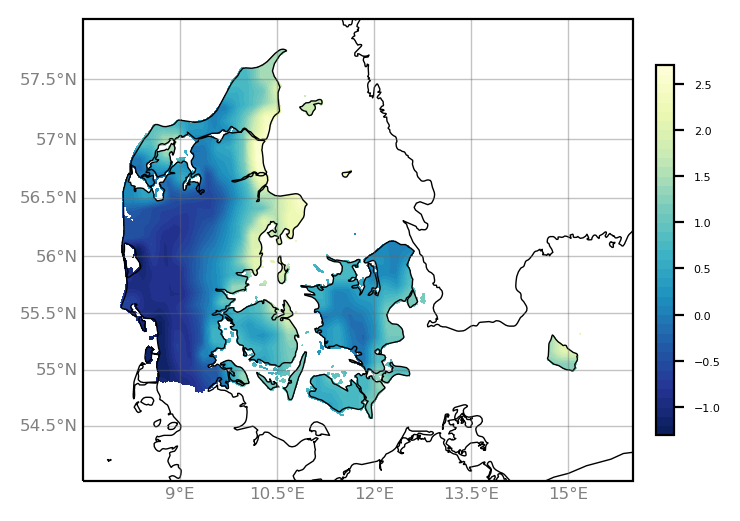
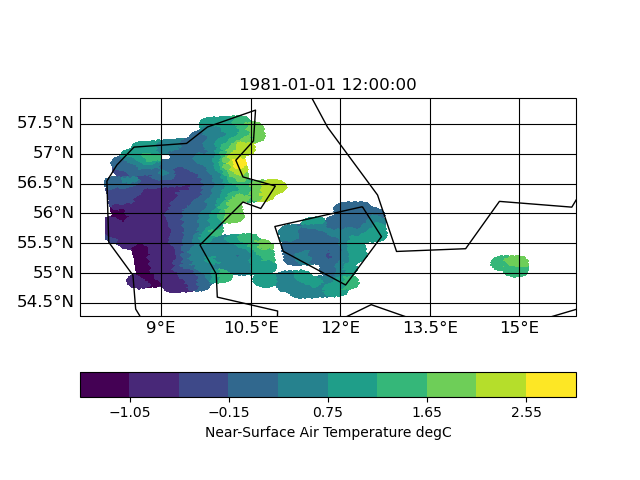
RE: unwanted output from cdo remapbil - Added by Karin Meier-Fleischer about 5 years ago
Here comes the script and plot using matplotlib/cartopy.
import xarray as xr
import numpy as np
import matplotlib.pyplot as plt
from matplotlib import cm
import cartopy.crs as ccrs

ds  = xr.open_dataset("outfile_remapnn_setmisstonn.nc")
var = ds.tas[0,:,:]
lat = ds.lat
lon = ds.lon

da = xr.DataArray(var, dims=["y", "x"], coords={"lat": (("y", "x"), lat), "lon": (("y", "x"), lon)})

projection = ccrs.Mercator(central_longitude=10.0)
colormap = 'YlGnBu_r'

fig = plt.figure(figsize=(5, 3))
ax = plt.axes(projection=projection)
ax.set_extent([7.5, 16., 54., 58.], ccrs.PlateCarree())
ax.coastlines(linewidth=0.5,)

gl = ax.gridlines(draw_labels=True, linewidth=0.5, color='dimgray', alpha=0.4,)
gl.xlabel_style = {'size': 6, 'color': 'gray'}
gl.ylabel_style = {'size': 6, 'color': 'gray'}
gl.right_labels = False
gl.top_labels  = False

contourf = ax.contourf(lon[1:-1], lat[1:-1], var[1:-1,:], levels=40,
                        transform=ccrs.PlateCarree(), cmap=colormap)

cbar = fig.colorbar(contourf, ax=ax, fraction=0.13, pad=0.03, shrink=0.8)
cbar.ax.tick_params(labelsize=4)

plt.savefig('plot_Denmark_curvilinear.png', bbox_inches='tight', dpi=200)